Test a claim that the mean amount of carbon monoxide in the air in U.S. cities is less than 2.32 parts per million. It was found that the mean amou monoxide in the air for the random sample of 66 cities is 2.39 parts per million and the standard deviation is 2.09 parts per million. At a = 0.10, can supported? Complete parts (a) through (e) below. Assume the population is normally distributed. (a) Identify the claim and state Ho and Ha. Which of the following correctly states Ho and Ha? Ho: Ha: (Type integers or decimals. Do not round.) The claim is the hypothesis. (b) Use technology to find the critical value(s) and identify the rejection region(s). The critical value(s) is/are to = 1: (Use a comma to separate answers as needed. Round to two decimal places as needed.) Choose the graph which shows the rejection region. OB. Oc. OD. O A. t< - to, t> to t to - to
Test a claim that the mean amount of carbon monoxide in the air in U.S. cities is less than 2.32 parts per million. It was found that the mean amou monoxide in the air for the random sample of 66 cities is 2.39 parts per million and the standard deviation is 2.09 parts per million. At a = 0.10, can supported? Complete parts (a) through (e) below. Assume the population is normally distributed. (a) Identify the claim and state Ho and Ha. Which of the following correctly states Ho and Ha? Ho: Ha: (Type integers or decimals. Do not round.) The claim is the hypothesis. (b) Use technology to find the critical value(s) and identify the rejection region(s). The critical value(s) is/are to = 1: (Use a comma to separate answers as needed. Round to two decimal places as needed.) Choose the graph which shows the rejection region. OB. Oc. OD. O A. t< - to, t> to t to - to

MATLAB: An Introduction with Applications
6th Edition
ISBN:9781119256830
Author:Amos Gilat
Publisher:Amos Gilat
Chapter1: Starting With Matlab
Section: Chapter Questions
Problem 1P

Related questions

Question
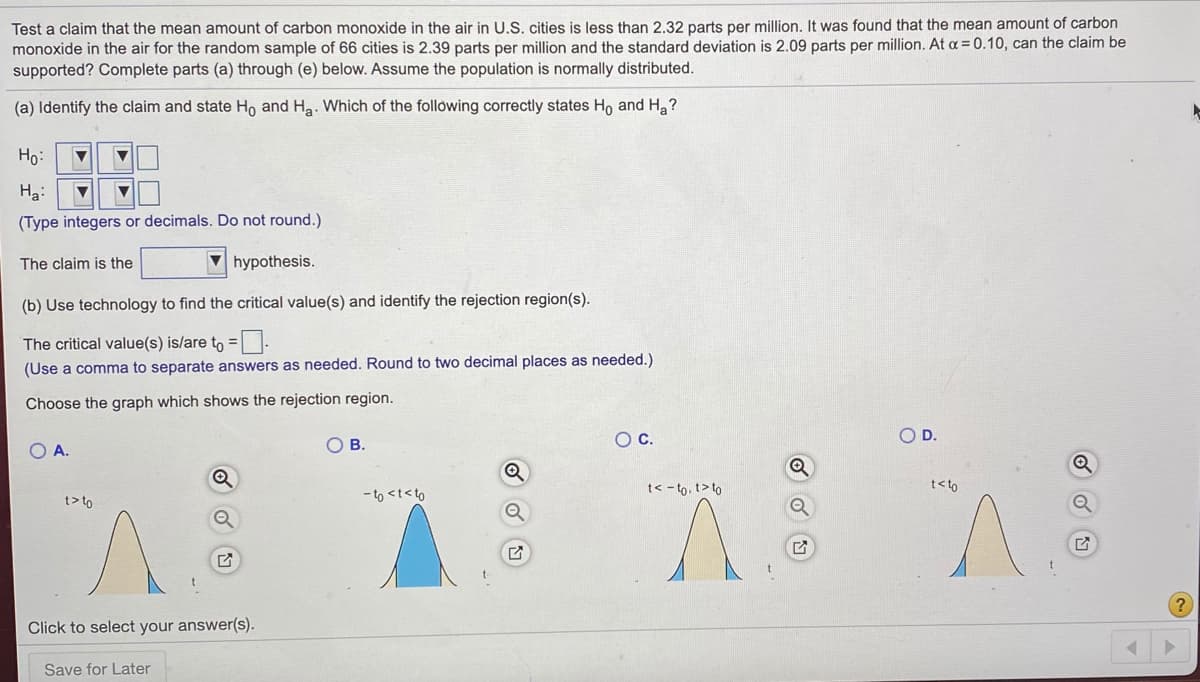
Transcribed Image Text:Test a claim that the mean amount of carbon monoxide in the air in U.S. cities is less than 2.32 parts per million. It was found that the mean amount of carbon
monoxide in the air for the random sample of 66 cities is 2.39 parts per million and the standard deviation is 2.09 parts per million. At a=0.10, can the claim be
supported? Complete parts (a) through (e) below. Assume the population is normally distributed.
(a) Identify the claim and state Ho and Ha. Which of the following correctly states Ho and H,?
Ho:
Ha:
(Type integers or decimals. Do not round.)
The claim is the
hypothesis.
(b) Use technology to find the critical value(s) and identify the rejection region(s).
The critical value(s) is/are to = :
(Use a comma to separate answers as needed. Round to two decimal places as needed.)
Choose the graph which shows the rejection region.
OB.
Oc.
OD.
O A.
t< - to, t> to
t< to
- to <t<to
t> to
Click to select your answer(s).
Save for Later
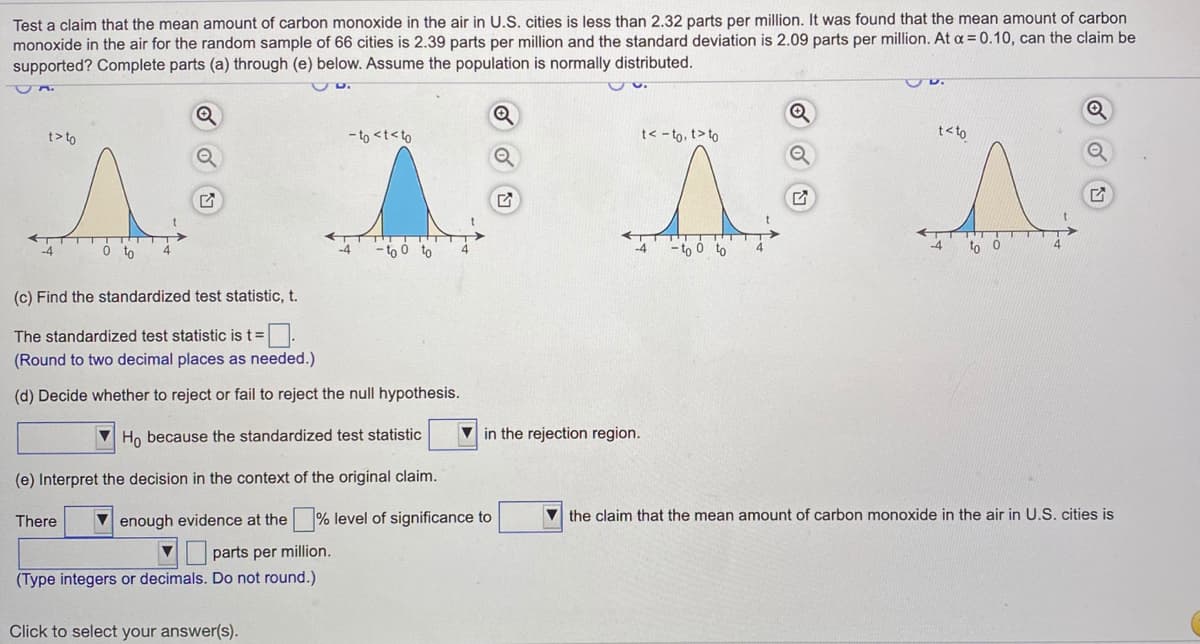
Transcribed Image Text:Test a claim that the mean amount of carbon monoxide in the air in U.S. cities is less than 2.32 parts per million. It was found that the mean amount of carbon
monoxide in the air for the random sample of 66 cities is 2.39 parts per million and the standard deviation is 2.09 parts per million. At a = 0.10, can the claim be
supported? Complete parts (a) through (e) below. Assume the population is normally distributed.
t>to
- to <t<to
t< -to, t> to
t<to
-4
0 to
-to 0 to
-4
to
(c) Find the standardized test statistic, t.
The standardized test statistic is t=
(Round to two decimal places as needed.)
(d) Decide whether to reject or fail to reject the null hypothesis.
V Ho because the standardized test statistic
V in the rejection region.
(e) Interpret the decision in the context of the original claim.
V enough evidence at the % level of significance to
V the claim that the mean amount of carbon monoxide in the air in U.S. cities is
There
parts per million.
(Type integers or decimals. Do not round.)
Click to select your answer(s).
Expert Solution
This question has been solved!
Explore an expertly crafted, step-by-step solution for a thorough understanding of key concepts.

This is a popular solution!

Trending now
This is a popular solution!

Step by step
Solved in 2 steps with 1 images

Knowledge Booster


Learn more about
Need a deep-dive on the concept behind this application? Look no further. Learn more about this topic, statistics and related others by exploring similar questions and additional content below.Recommended textbooks for you
MATLAB: An Introduction with Applications
Statistics
ISBN:
9781119256830
Author:
Amos Gilat
Publisher:
John Wiley & Sons Inc

Probability and Statistics for Engineering and th…
Statistics
ISBN:
9781305251809
Author:
Jay L. Devore
Publisher:
Cengage Learning

Statistics for The Behavioral Sciences (MindTap C…
Statistics
ISBN:
9781305504912
Author:
Frederick J Gravetter, Larry B. Wallnau
Publisher:
Cengage Learning
MATLAB: An Introduction with Applications
Statistics
ISBN:
9781119256830
Author:
Amos Gilat
Publisher:
John Wiley & Sons Inc
Probability and Statistics for Engineering and th…
Statistics
ISBN:
9781305251809
Author:
Jay L. Devore
Publisher:
Cengage Learning
Statistics for The Behavioral Sciences (MindTap C…
Statistics
ISBN:
9781305504912
Author:
Frederick J Gravetter, Larry B. Wallnau
Publisher:
Cengage Learning

Elementary Statistics: Picturing the World (7th E…
Statistics
ISBN:
9780134683416
Author:
Ron Larson, Betsy Farber
Publisher:
PEARSON

The Basic Practice of Statistics
Statistics
ISBN:
9781319042578
Author:
David S. Moore, William I. Notz, Michael A. Fligner
Publisher:
W. H. Freeman

Introduction to the Practice of Statistics
Statistics
ISBN:
9781319013387
Author:
David S. Moore, George P. McCabe, Bruce A. Craig
Publisher:
W. H. Freeman