Test each of the hypotheses by using the given information: 1. Ho : p = 0.35, Ha :p > 0.35 Sample size (n)= 180 Sample proportion=0.40 a= 0.05 a. Compute the test-statistic. b. Determine the critical value and draw the normal curve. c. Conclusion.
Test each of the hypotheses by using the given information: 1. Ho : p = 0.35, Ha :p > 0.35 Sample size (n)= 180 Sample proportion=0.40 a= 0.05 a. Compute the test-statistic. b. Determine the critical value and draw the normal curve. c. Conclusion.

Algebra & Trigonometry with Analytic Geometry
13th Edition
ISBN:9781133382119
Author:Swokowski
Publisher:Swokowski
Chapter10: Sequences, Series, And Probability
Section10.7: Distinguishable Permutations And Combinations
Problem 15E

Related questions
Question
Transcribed Image Text:Statistics - Microsoft Word
Home
Insert
Page Layout
References
Mailings
Review
View
* Cut
A Find -
- 12
AA
Arial
A A
Aal
AaBbCc AaBbCc AaBbC AaBbCc AaB AaBbCc. AaBbCcD AaBbCcD
A Copy
ab. Replace
Paste
B I U
Change
Styles - Select -
Format Painter
abe x, x Aa
I Normal
T No Spaci. Heading 1 Heading 2
Title
Subtitle
Subtle Em. Emphasis
Clipboard
Font
Paragraph
Styles
Editing
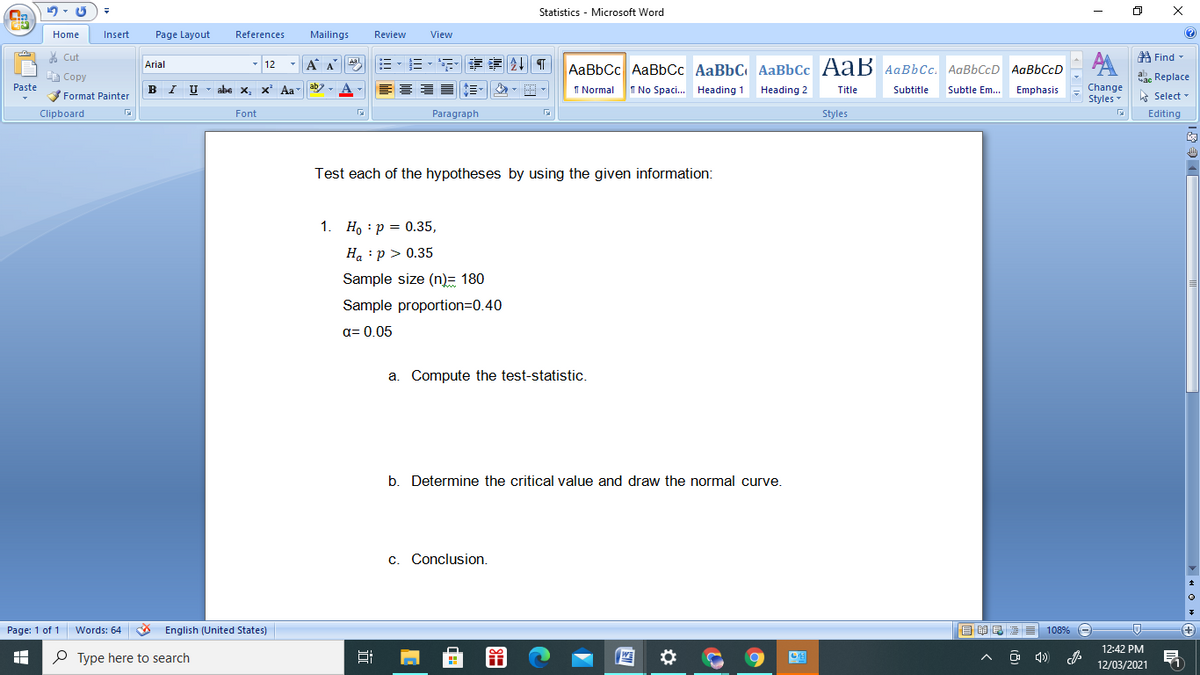
Test each of the hypotheses by using the given information:
1. Ho : p = 0.35,
H. :p > 0.35
Sample size (n)= 180
Sample proportion=D0.40
a= 0.05
a. Compute the test-statistic.
b. Determine the critical value and draw the normal curve.
c. Conclusion.
Page: 1 of 1
Words: 64 English (United States)
目 昆 ■
108%
12:42 PM
O Type here to search
12/03/2021
Expert Solution
This question has been solved!
Explore an expertly crafted, step-by-step solution for a thorough understanding of key concepts.

This is a popular solution!

Trending now
This is a popular solution!

Step by step
Solved in 3 steps with 1 images

Knowledge Booster


Learn more about
Need a deep-dive on the concept behind this application? Look no further. Learn more about this topic, statistics and related others by exploring similar questions and additional content below.Recommended textbooks for you
Algebra & Trigonometry with Analytic Geometry
Algebra
ISBN:
9781133382119
Author:
Swokowski
Publisher:
Cengage
Algebra & Trigonometry with Analytic Geometry
Algebra
ISBN:
9781133382119
Author:
Swokowski
Publisher:
Cengage