Listed in the accompanying table are waiting times (seconds) of observed cars at a Delaware inspection station. The data from two waiting lines are real observations, and the data from the single waiting line are modeled from those real observations. Assume that the two samples are independent simple random samples selected from normally distributed populations, and do not assume that the population standard deviations are equal. Complete parts (a) and (b). a. Use a 0.01 significance level to test the claim that cars in two queues have a mean waiting time equal to that of cars in a single queue. Let population 1 correspond to the single waiting line and let population 2 correspond to two waiting lines. What are the null and alternative hypotheses? A. H0: μ1≠μ2 H1: μ1=μ2 B. H0: μ1=μ2 H1: μ1>μ2 C. H0: μ1<μ2 H1: μ1=μ2 D. H0: μ1=μ2 H1: μ1≠μ2 Calculate the test statistic. t=_____ (Round to two decimal places as needed.) Find the P-value. P-value=_____ (Round to three decimal places as needed.) Make a conclusion about the null hypothesis and a final conclusion that addresses the original claim. Use a significance level of 0.01. ▼ Fail to reject Reject H0 because the P-value is ▼ greater than less than or equal to the significance level. There ▼ is is not sufficient evidence to warrant ▼ support for rejection of the claim that cars in two queues have a mean waiting time equal to that of cars in a single queue. b. Construct the confidence interval suitable for testing the claim in part (a). _____ <μ1−μ2< _____ (Round to one decimal place as needed.)
Listed in the accompanying table are waiting times (seconds) of observed cars at a Delaware inspection station. The data from two waiting lines are real observations, and the data from the single waiting line are modeled from those real observations. Assume that the two samples are independent simple random samples selected from normally distributed populations, and do not assume that the population standard deviations are equal. Complete parts (a) and (b). a. Use a 0.01 significance level to test the claim that cars in two queues have a mean waiting time equal to that of cars in a single queue. Let population 1 correspond to the single waiting line and let population 2 correspond to two waiting lines. What are the null and alternative hypotheses? A. H0: μ1≠μ2 H1: μ1=μ2 B. H0: μ1=μ2 H1: μ1>μ2 C. H0: μ1<μ2 H1: μ1=μ2 D. H0: μ1=μ2 H1: μ1≠μ2 Calculate the test statistic. t=_____ (Round to two decimal places as needed.) Find the P-value. P-value=_____ (Round to three decimal places as needed.) Make a conclusion about the null hypothesis and a final conclusion that addresses the original claim. Use a significance level of 0.01. ▼ Fail to reject Reject H0 because the P-value is ▼ greater than less than or equal to the significance level. There ▼ is is not sufficient evidence to warrant ▼ support for rejection of the claim that cars in two queues have a mean waiting time equal to that of cars in a single queue. b. Construct the confidence interval suitable for testing the claim in part (a). _____ <μ1−μ2< _____ (Round to one decimal place as needed.)

MATLAB: An Introduction with Applications
6th Edition
ISBN:9781119256830
Author:Amos Gilat
Publisher:Amos Gilat
Chapter1: Starting With Matlab
Section: Chapter Questions
Problem 1P

Related questions
Question
Listed in the accompanying table are waiting times (seconds) of observed cars at a Delaware inspection station. The data from two waiting lines are real observations, and the data from the single waiting line are modeled from those real observations. Assume that the two samples are independent simple random samples selected from normally distributed populations, and do not assume that the population standard deviations are equal. Complete parts (a) and (b).
a. Use a 0.01 significance level to test the claim that cars in two queues have a mean waiting time equal to that of cars in a single queue.
Let population 1 correspond to the single waiting line and let population 2 correspond to two waiting lines. What are the null and alternative hypotheses?
H0:
μ1≠μ2
H1:
μ1=μ2
H0:
μ1=μ2
H1:
μ1>μ2
H0:
μ1<μ2
H1:
μ1=μ2
H0:
μ1=μ2
H1:
μ1≠μ2
Calculate the test statistic.
t=_____
(Round to two decimal places as needed.)Find the P-value.
P-value=_____
(Round to three decimal places as needed.)Make a conclusion about the null hypothesis and a final conclusion that addresses the original claim. Use a significance level of
0.01.
▼
Fail to reject
Reject
H0
because the P-value is
▼
greater than
less than or equal to
▼
is
is not
▼
support for
rejection of
b. Construct the confidence interval suitable for testing the claim in part (a).
_____ <μ1−μ2< _____
(Round to one decimal place as needed.)
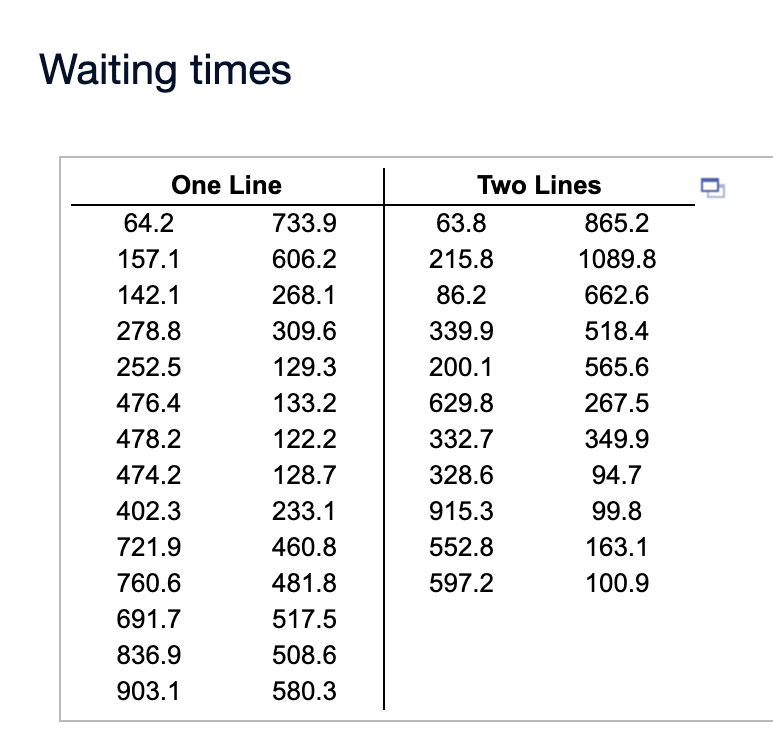
Transcribed Image Text:Waiting times
One Line
Two Lines
64.2
733.9
63.8
865.2
157.1
606.2
215.8
1089.8
142.1
268.1
86.2
662.6
278.8
309.6
339.9
518.4
252.5
129.3
200.1
565.6
476.4
133.2
629.8
267.5
478.2
122.2
332.7
349.9
474.2
128.7
328.6
94.7
402.3
233.1
915.3
99.8
721.9
460.8
552.8
163.1
760.6
481.8
597.2
100.9
691.7
517.5
836.9
508.6
903.1
580.3
Expert Solution
This question has been solved!
Explore an expertly crafted, step-by-step solution for a thorough understanding of key concepts.

This is a popular solution!

Trending now
This is a popular solution!

Step by step
Solved in 5 steps with 5 images

Recommended textbooks for you
MATLAB: An Introduction with Applications
Statistics
ISBN:
9781119256830
Author:
Amos Gilat
Publisher:
John Wiley & Sons Inc

Probability and Statistics for Engineering and th…
Statistics
ISBN:
9781305251809
Author:
Jay L. Devore
Publisher:
Cengage Learning

Statistics for The Behavioral Sciences (MindTap C…
Statistics
ISBN:
9781305504912
Author:
Frederick J Gravetter, Larry B. Wallnau
Publisher:
Cengage Learning
MATLAB: An Introduction with Applications
Statistics
ISBN:
9781119256830
Author:
Amos Gilat
Publisher:
John Wiley & Sons Inc
Probability and Statistics for Engineering and th…
Statistics
ISBN:
9781305251809
Author:
Jay L. Devore
Publisher:
Cengage Learning
Statistics for The Behavioral Sciences (MindTap C…
Statistics
ISBN:
9781305504912
Author:
Frederick J Gravetter, Larry B. Wallnau
Publisher:
Cengage Learning

Elementary Statistics: Picturing the World (7th E…
Statistics
ISBN:
9780134683416
Author:
Ron Larson, Betsy Farber
Publisher:
PEARSON

The Basic Practice of Statistics
Statistics
ISBN:
9781319042578
Author:
David S. Moore, William I. Notz, Michael A. Fligner
Publisher:
W. H. Freeman

Introduction to the Practice of Statistics
Statistics
ISBN:
9781319013387
Author:
David S. Moore, George P. McCabe, Bruce A. Craig
Publisher:
W. H. Freeman