Suppose a sample of O-rings was obtained and the wall thickness (in inches) of each was recorded. Use a normal probablity plot to assess whether the sample data could have come from a population that is nomally distributed. 0.191 0.184 0.199 0.197 0.209 0220 0.233 0.248 0.263 0.270 0208 0.300 0.30 0.302 0.303 0.318 Click here to view the table of.critical values, Cick here to view.page 1.of the standard normal distribution table. Click.here to view.naon. 2. of the standard.notmal distribution table. Using the correlation coefficient of the normal probability plot, is it reasonable to conclude that the population is normally distributed? Select the correct choice below and All in the answer boxes within your choice. (Round to three decimal places as needed.) does not exceed the oritical value, Therefore, it is not reasonable to conclude that OA No. The correlation between the expected z-ncores and the observed data, the data come from a normal population. exceeds the critical value, Therefore, it is not reasonable to conclude that the data OB. Yes. The correlation between the expected z-soores and the observed data, come from a nomal population. 2-1 does not exoeed the critical value,. Therefore, it is reasonable to conclude that the OC. No. The correlation between the expected z-acores and the observed data, data come from a normal population. Therefore, it is reasonable to conclude that the data O D. Yes. The correlation between the expected z-scores and the observed data, come from a normal population. exceeds the critical value.
Suppose a sample of O-rings was obtained and the wall thickness (in inches) of each was recorded. Use a normal probablity plot to assess whether the sample data could have come from a population that is nomally distributed. 0.191 0.184 0.199 0.197 0.209 0220 0.233 0.248 0.263 0.270 0208 0.300 0.30 0.302 0.303 0.318 Click here to view the table of.critical values, Cick here to view.page 1.of the standard normal distribution table. Click.here to view.naon. 2. of the standard.notmal distribution table. Using the correlation coefficient of the normal probability plot, is it reasonable to conclude that the population is normally distributed? Select the correct choice below and All in the answer boxes within your choice. (Round to three decimal places as needed.) does not exceed the oritical value, Therefore, it is not reasonable to conclude that OA No. The correlation between the expected z-ncores and the observed data, the data come from a normal population. exceeds the critical value, Therefore, it is not reasonable to conclude that the data OB. Yes. The correlation between the expected z-soores and the observed data, come from a nomal population. 2-1 does not exoeed the critical value,. Therefore, it is reasonable to conclude that the OC. No. The correlation between the expected z-acores and the observed data, data come from a normal population. Therefore, it is reasonable to conclude that the data O D. Yes. The correlation between the expected z-scores and the observed data, come from a normal population. exceeds the critical value.

MATLAB: An Introduction with Applications
6th Edition
ISBN:9781119256830
Author:Amos Gilat
Publisher:Amos Gilat
Chapter1: Starting With Matlab
Section: Chapter Questions
Problem 1P

Related questions
Question
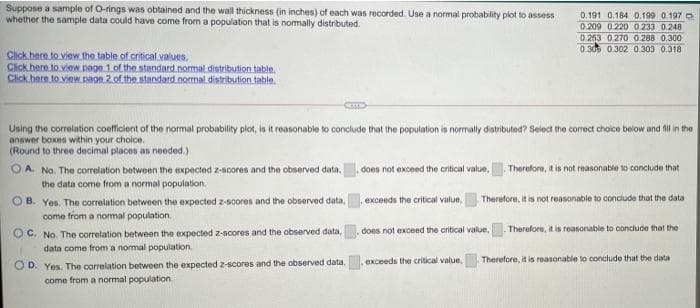
Transcribed Image Text:Suppose a sample of O-rings was obtained and the wall thickness (in inches) of each was recorded. Use a normal probability plot to assess
whether the sample data could have come from a population that is nomally distributed.
0.191 0.184 0.199 0.197
0.209 0.220 0.233 0.248
0.253 0.270 0 288 0.300
0.309 0.302 0.303 0.318
Click here to view the table of critical values.
Cick here to view.page 1 of the standard normal distribution table.
Click hece to view. paon 2 of the standard.notmal distribution table.
Using the correlation coefficient of the normal probability plot, is it reasonable to conclude that the population is normally distributed? Select the corect choice below and fil in the
answer boxes within your choice.
(Round to three decimal places as needed.)
OA. No. The correlation between the expected z-ncores and the observed data,
does not exceed the oritical value,
Therofore, it is not reasonable to conclude that
the data come from a normal population.
OB. Yes. The correlation between the expected z-scores and the observed data,
exceeds the critical value,
Therefore, it is not reasonable to conclude that the data
come from a nomal population.
Therefore, it is reasonable to conclude that the
O C. No. The correlation between the expected z-scores and the observed data,
data come from a normal population.
does not exceed the critical value,
Therefore, it is reasonable to conclude that the data
O D. Yes. The correlation between the expected z-scores and the observed data,
come from a normal population.
exceeds the critical value
Expert Solution
This question has been solved!
Explore an expertly crafted, step-by-step solution for a thorough understanding of key concepts.

This is a popular solution!

Trending now
This is a popular solution!

Step by step
Solved in 2 steps with 3 images

Recommended textbooks for you
MATLAB: An Introduction with Applications
Statistics
ISBN:
9781119256830
Author:
Amos Gilat
Publisher:
John Wiley & Sons Inc

Probability and Statistics for Engineering and th…
Statistics
ISBN:
9781305251809
Author:
Jay L. Devore
Publisher:
Cengage Learning

Statistics for The Behavioral Sciences (MindTap C…
Statistics
ISBN:
9781305504912
Author:
Frederick J Gravetter, Larry B. Wallnau
Publisher:
Cengage Learning
MATLAB: An Introduction with Applications
Statistics
ISBN:
9781119256830
Author:
Amos Gilat
Publisher:
John Wiley & Sons Inc
Probability and Statistics for Engineering and th…
Statistics
ISBN:
9781305251809
Author:
Jay L. Devore
Publisher:
Cengage Learning
Statistics for The Behavioral Sciences (MindTap C…
Statistics
ISBN:
9781305504912
Author:
Frederick J Gravetter, Larry B. Wallnau
Publisher:
Cengage Learning

Elementary Statistics: Picturing the World (7th E…
Statistics
ISBN:
9780134683416
Author:
Ron Larson, Betsy Farber
Publisher:
PEARSON

The Basic Practice of Statistics
Statistics
ISBN:
9781319042578
Author:
David S. Moore, William I. Notz, Michael A. Fligner
Publisher:
W. H. Freeman

Introduction to the Practice of Statistics
Statistics
ISBN:
9781319013387
Author:
David S. Moore, George P. McCabe, Bruce A. Craig
Publisher:
W. H. Freeman