Test stat: p value: Construct a confidence interval suitable for testing the claim that the two samples are from population with same mean ____
Test stat: p value: Construct a confidence interval suitable for testing the claim that the two samples are from population with same mean ____

College Algebra (MindTap Course List)
12th Edition
ISBN:9781305652231
Author:R. David Gustafson, Jeff Hughes
Publisher:R. David Gustafson, Jeff Hughes
Chapter8: Sequences, Series, And Probability
Section8.7: Probability
Problem 58E: What is meant by the sample space of an experiment?

Related questions

Question
Test stat:
p value:
Construct a confidence interval suitable for testing the claim that the two samples are from population with same mean
____<u1-u2<___
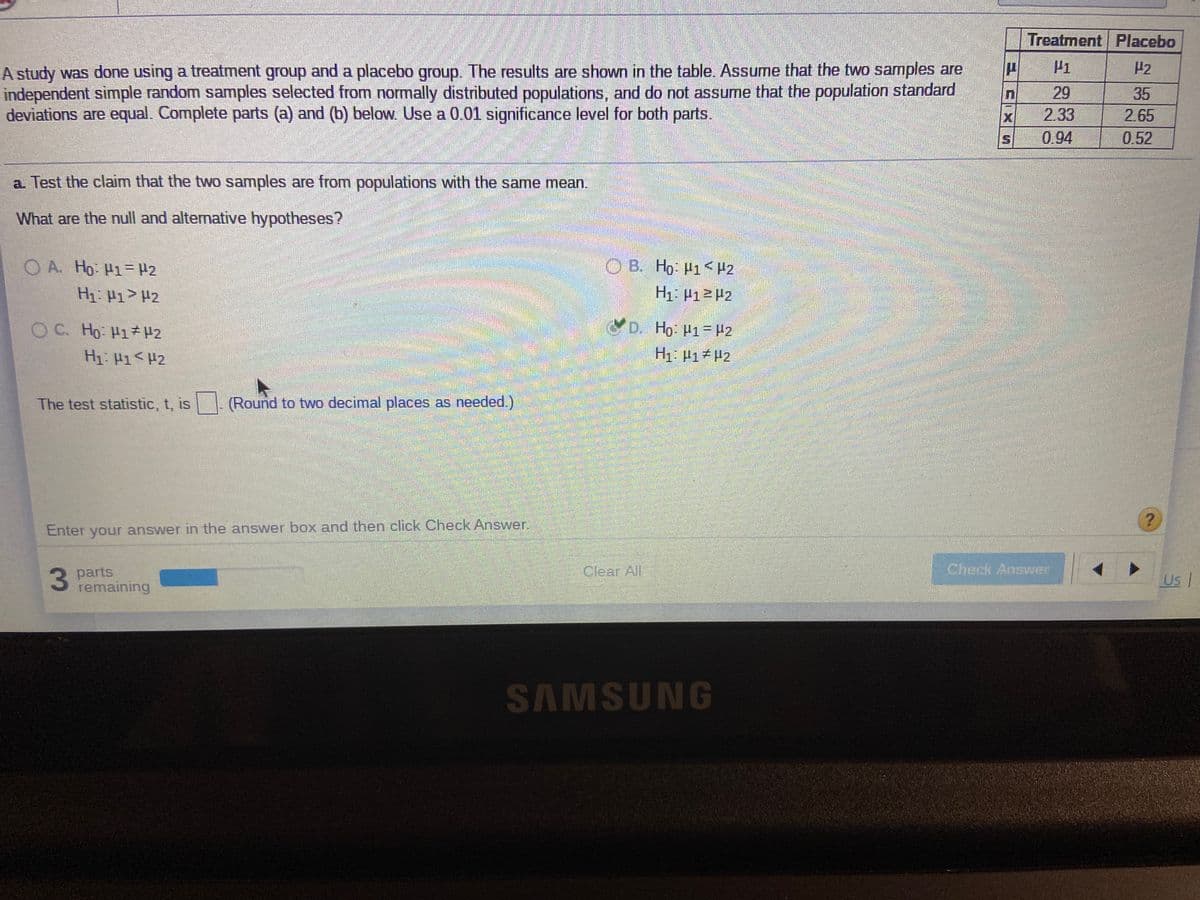
Transcribed Image Text:Treatment Placebo
P1
A study was done using a treatment group and a placebo group. The results are shown in the table. Assume that the two samples are
independent simple random samples selected from normally distributed populations, and do not assume that the population standard
deviations are equal. Complete parts (a) and (b) below. Use a 0.01 significance level for both parts.
P2
29
35
X
2.33
2.65
0.94
0.52
a. Test the claim that the two samples are from populations with the same mean.
What are the null and alternative hypotheses?
O A. Ho H1- H2
O B. Ho: H1<H2
H1: P1> #2
H1 P1>P2
O C. Ho H1H2
D. Ho: P1= H2
H1: 41<H2
H1. H1 P2
The test statistic, t, is
(Round to two decimal places as needed.)
Enter your answer in the answer box and then click Check Answer.
Check Answer
3 parts
remaining
Clear All
Us
SAMSUNG
Expert Solution
This question has been solved!
Explore an expertly crafted, step-by-step solution for a thorough understanding of key concepts.

Step by step
Solved in 2 steps with 7 images

Knowledge Booster


Learn more about
Need a deep-dive on the concept behind this application? Look no further. Learn more about this topic, statistics and related others by exploring similar questions and additional content below.Recommended textbooks for you
College Algebra (MindTap Course List)
Algebra
ISBN:
9781305652231
Author:
R. David Gustafson, Jeff Hughes
Publisher:
Cengage Learning
College Algebra (MindTap Course List)
Algebra
ISBN:
9781305652231
Author:
R. David Gustafson, Jeff Hughes
Publisher:
Cengage Learning