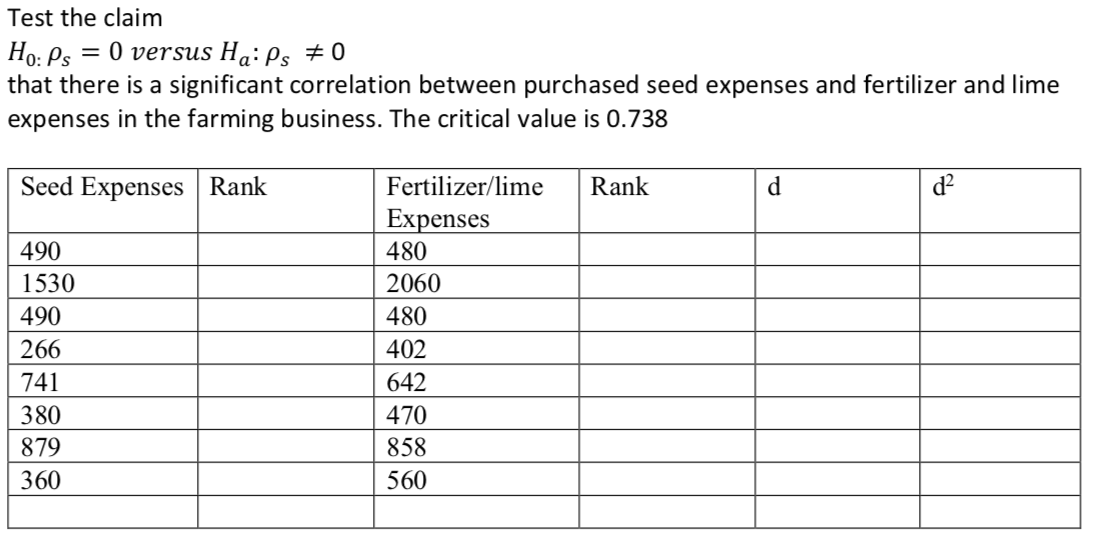
Test the claim Ho: Ps = 0 versus Ha: Ps #0 that there is a significant correlation between purchased seed expenses and fertilizer and lime expenses in the farming business. The critical value is 0.738 Seed Expenses Rank Fertilizer/lime Rank d. d? Expenses 490 480 1530 2060 490 480 266 402 741 642 380 470 879 858 360 560


Q: ANOVA df SS Regression 3 45.9634 Residual 11 2.6218 Total
A: Since you have posted a question with multiple sub-parts, we will solve first three sub-parts for…
Q: (Round to three decimal places as needed.) (c) Does a linear relation exist between the number of…
A: From Part (b), the linear correlation efficient is 0.963.
Q: The following table gives the ages and blood pressure of 9 women. Age (X) : 56 42 36 47 49 42 60 72…
A: From given data, X Y X*Y X*X Y*Y 56 147 8232 3136 21609 42 125 5250 1764 15625 36 118 4248…
Q: Based on the data shown below, calculate the correlation coefficient (to three decimal places). This…
A:
Q: 1. A study of the potential of acrylonitrile to produce brain tumors in rats was conducted by…
A: Givenstudy of optential of acrylonitrile to produce brain tumors in rats was conducted by…
Q: A student used multiple regression analysis to study how family spending (y) is influenced by income…
A: Hey there! Thank you for posting the question. Since your question has more than 3 parts, we are…
Q: Consider the regression Y = a, + az X + a; Z+u. we know that if there is a strong linear correlation…
A: Given statement, 'if there is a strong linear correlation between X and Z then it is more likely…
Q: Below is bivariate data on vintage dresser auctions, where X is the year of construction of the…
A: For the given data ( a ) correlation = ? ( b) Regreesion line = ? ( c ) Predict when x =1865
Q: An article in Technometrics (1974, Vol. 16, pp. 523–531) considered the following stack-loss data…
A: Consider the stack loss data from a plant oxidizing ammonia to nitric acid. Twenty one daily…
Q: Below is bivariate data on vintage dresser auctions, where X is the year of construction of the…
A: For the given data Find Correlation ,regression line
Q: A student used multiple regression analysis to study how family spending (y) is influenced by income…
A:
Q: 1.) Data below lists actual and predicted high temperatures for ten different random days. Actual:…
A: a) Let X: Actual temperature & Y:Predicted temperature Using Excel, Mean of X=78.5 and the mean…
Q: Regression methods were used to analyze the data from a study investigating the relationship between…
A: Given Information : Regression method are used to analyze the data from a study investigating the…
Q: The scatter plot shows the sizes and annual rents of some office spaces in the downtown area of a…
A: Strong positive correlation If the points are in increasing order and are very close to form a…
Q: 139 264 278 470 569 304 675 271 162 Y 94 222 241 428 500 275 394 232 | 133 а) Compute the…
A: x y u v u2 v2 uv 139 94 -361 -406 130321 164836 146566 264 222 -236 -278 55696 77284 65608 278…
Q: The data below are from an independent-measures experiment comparing three different treatment…
A: Given Information: Total no. of treatments=03No. of observations (n)=12
Q: Hoaglin, Mosteller, and Tukey (1983) present data on blood levels of beta-endorphin as a function of…
A: From the samples given n=19 As they are dependent samples the appropriate effect size can be Cohan’s…
Q: Consider the setting of Exercise 1. The residuals corresponding to the LSQ line, HR = 133.72 – 280.8…
A: Given information: The residual plot for the regression model is given.
Q: A student used multiple regression analysis to study how family spending (y) is influenced by income…
A: Hello. Since your question has multiple sub-parts, we will solve first three sub-parts for you. If…
Q: A student used multiple regression analysis to study how family spending (y) is influenced by income…
A: The percentage of variation explained in the response variable by the independent variables is…
Q: A paper gives data on x- change in Body Mass Index (BMI, in kilograms/meter*) and y- change in a…
A:
Q: A study of iron deficiency among infants compared blood hemoglobin levels of a random sample of…
A: Note: Since you have posted a question with multiple subparts, we will solve the first three…
Q: A scientist is interested in investigating the effect of organic fertilizers on the growth and yield…
A: i) The organic fertilizer is the independent variable (x) and the growth and yield of broccoli is…
Q: Consider the regression Y = a, + az X+ azZ +u. we know that if there is a strong linear correlation…
A: It is stated that " if there is a strong correlation between X and Z then it is more likely that the…
Q: A student used multiple regression analysis to study how family spending (y) is influenced by income…
A: From the given information, 1) From the above data following information can extract as:
Q: The commercial division of a real estate firm is conducting a regression analysis of the…
A: Hello! As you have posted more than 3 sub parts, we are answering the first 3 sub-parts. In case…
Q: A highway department is studying the relationship between traffic flow and speed. The following…
A:
Q: Biologists have found that there is a relationship between the rate of a cricket’s chirp and the…
A: a. In this given problem, chirps per second is the independent variable (x) and the temperature is…
Q: A highway department is studying the relationship between traffic flow and speed. The following…
A: a) From the given information, y x x^2 1,254 35 1225 1,330 40 1600 1,228 30 900 1,334 45…
Q: The scatter plot shows the sizes and annual rents of some office spaces in the downtown area of a…
A: If the data show an uphill pattern as you move from left to right, this indicates a positive…
Q: The response sensitivity of a toxic gas detection sensor is optimized based on two significant…
A: Let us solve the given problem in the next steps.
Q: 2. An experiment is done to investigate the impact of glass type and phosphor type on the brightness…
A: Given data, Response variable : Brightness level of television tube
Q: The following data represents the amount in kg of fertilizer applied to equal size of plots and the…
A: Given information: Correlation(X, Y)=0.9648
Q: A student used multiple regression analysis to study how family spending (y) is influenced by income…
A: 1. Considering the providing data, the estimated regression equation for the relationship between…
Q: It is believed that standardized test scores, such as SAT, is a good predictor of first-year college…
A: Given data: X Y 1200 3.2 1120 2.5 1000 2.7 1420 3.5 1280 2.9 750 2.2 1100 2.3
Q: A student used multiple regression analysis to study how family spending (y) is influenced by income…
A: Hey, since there are multiple subparts posted, we will answer first three subparts. If you want any…
Q: Use alpha of 0.05 2 tail. Free Association (in seconds) Partially Controlled (in seconds)…
A: Let X1 and X2 denote free association time and partially control time, respectively. Cohen's d is…
Q: The annual consumer expenditures and annual net incomes of a sample of 7 families in Cambodia in…
A: Solution : Given data is Family Net Income (x) Expenditure (y) A 6 15 B 15 7 C 3 18 D 16…
Q: The following demand function for a price-setting firm selling good X was estimated using standard…
A: From the estimation results, the regression equation is Q = 450 – 10P + 0.2M – 6.2PR
Q: Consider the setting of Exercise 1. The residuals corresponding to the LSQ line, HR = 133.72 – 280.8…
A: Note: Hi there! Thank you for posting the question. As you have posted multiple questions, as per…
Q: (Prob. 11-12, p. 438) An article in the Journal of Environmental Engineering (1989, Vol. 115(3), pp.…
A:
Q: Data on advertising expenditures and revenue (in thousands of dollars) for the Four Seasons…
A: Since you have posted multiple sub parts, but I am submitting first 3 parts as per Bartleby…
Q: Using the data from the prior correlation question (altruism and health), Find the regression line…
A: Regression equation is used to predict the value of response variables using the explanatory…
Q: X Y 9 5 8 4 3 7 10 5 9 Find the regression equation for predicting Y from X. Σχ SSx ΣΥ ΣΧΥ SP 30…
A: The given data is as follows:
Q: A study considered the porosity of an ultrafine powder of partially stabilized zirconia as a…
A: The scatter plot can be obtained using EXCEL software. Enter the values of X in column A and Y in…
Q: i) Express the relationship between the exhausted age and dry matter level with the regression…
A: X (Age) Y (Dry matter) (x-xbar) (x-xbar)^2 (y-ybar) (y-ybar)^2 (x-xbar)*(y-ybar) 4 24 -7 49 -17.25…
Q: The following table gives the regression results of consumption behaviour between female and male.…
A: Note: Hey there! Thank you for the question. As you have posted multiple sub-parts, we have helped…
Q: According to "Reproductive Biology of the Aquatic Salamander Amphiuma tridactylum in Louisiana,"t…
A:
Q: A highway department is studying the relationship between traffic flow and speed. The following…
A: When we want to estimate an impact of many variables on the one variable at that time we…
Q: Based on the data shown below, calculate the correlation coefficient (to three decimal places). This…
A: Given data, X Y X*Y X*X Y*Y 2 8.38 16.76 4 70.2244 3 6.35 19.05 9 40.3225 4 7.92 31.68 16…

Step by step
Solved in 2 steps with 1 images


- Test the null hypothesis that the slope coefficient for ‘GROWTH’ is less than or equal to 0.07 against the alternative that it is greater than 0.07 (i.e. <=0.07 OR >0.07). The critical t value is 1.645 for a one-tailed test at the 5% significance level.X” denote the number of children ever born to a woman, and let “Y” denote years ofeducation for the woman. A simple model relating fertility to years of education is X = β0 + β1Y + u where u is the unobserved error. (i) What kind of factors are contained in u? Are these likely to be correlated with level of education?Lyme disease is an inflammatory disease that results in a skin rash and flulike symptoms. It is transmitted through the bite of an infected deer tick. The following data represent the number of reported cases of Lyme disease and the number of drowning deaths for a rural county. Cases_of_Lyme_Disease Drowning_Deaths Month3 0 J2 1 F2 2 M4 1 A5 3 M15 9 J22 17 J13 5 A6 3…
- Researchers studied the effect of a houseplant fertilizer on carrot sprout growth. They randomly selected some carrot seeds to serve as controls, while others were planted in aluminum planters to which fertilizer sticks were added. Other conditions were held constant between the two groups. The following table shows data on the heights of plants (in cm) 2 weeks after germination. Use a t test to investigate whether the fertilizer has an effect on average carrot sprout growth. Use a = 0.05.Second-Hand Smoke: Data Set 12 “Passive and Active Smoke” in Appendix B includes cotinine levels measured in a group of nonsmokers exposed to tobacco smoke (n = 40, Mean = 60.58 ng>mL, s = 138.08 ng>mL) and a group of nonsmokers not exposed to tobacco smoke (n = 40, Mean = 16.35 ng>mL, s = 62.53 ng>mL). Cotinine is a metabolite of nicotine, meaning that when nicotine is absorbed by the body, cotinine is produced. Use a 0.05 significance level to test the claim that nonsmokers exposed to tobacco smoke have a higher mean cotinine level than nonsmokers not exposed to tobacco smoke. Construct the confidence interval appropriate for the hypothesis test in part a. What do you conclude about the effects of second-hand smoke?A student used multiple regression analysis to study how family spending (y) is influenced by income(x1), family size (x2), and additionsto savings(x3). The variables y, x1, and x3 are measured in thousandsof dollars. The following results were obtained. anova df ss regression 3 45.9634 residual 11 2.6218 total coefficient standard error intercept 0.0136 x1 0.7992 0.074 x2 0.2280 0.190 x3 -0.5796 0.920 a. Write out the estimated regression equation for the relationship between the variables. b. Compute coefficient of determination. What can you say about the strength of thisrelationship? c. Carry out a test to determine whether y is significantly related to the independent variables.Use a 5% level of significance. d. Carry out a test to see if x3 and y are significantly related. Use a 5% level of significance.
- A student used multiple regression analysis to study how family spending (y) is influenced by income (x1), family size (x2), and additionsto savings(x3). The variables y, x1, and x3 are measured in thousands of dollars. The following results were obtained. ANOVA df SS Regression 3 45.9634 Residual 11 2.6218 Total Coefficients Standard Error Intercept 0.0136 x1 0.7992 0.074 x2 0.2280 0.190 x3 -0.5796 0.920 a. Write out the estimated regression equation for the relationship between the variables. b. Compute coefficient of determination. What can you say about the strength of this relationship? c. Carry out a test to determine whether y is significantly related to the independent variables. Use…The first step of the Durbin-Watson test for the presence of autocorrelation is to estimate the model and determine Select one: a. the residuals lagged one period. b. the current period residuals and the residuals lagged one period. c. the current period residuals. d. the current period residuals, the residuals lagged one period, and the residuals lagged two periods.A student used multiple regression analysis to study how family spending (y) is influenced by income (x1), family size (x2), and additions to savings(x3). The variables y, x1, and x3 are measured in thousands of dollars. The following results were obtained. ANOVA df SS Regression 3 45.9634 Residual 11 2.6218 Coefficients Standard Error Intercept 0.0136 x 1 0.7992 0.074 x2 0.2280 0.190 x3 -0.5796 0.920 Required: c. Carry out a test to determine whether y is significantly related to the independent variables. Use a 5% level of significance. d. Carry out a test to see if x3 and y are significantly related. Use a 5% level of significance.
- A study of Spring Peeper breeding yielded the results in the table below. Spring Peepers were bred in different temperature controlled environments. The concentration of dissolved oxygen was measured in each environment. Temperature of water (⁰C) Dissolved oxygen in freshwater (mg/L) Number of eggs hatched into tadpoles 8 10.0 80 8 12.0 100 8 13.5 120 8 16.0 150 15 8.0 600 15 9.5 1090 15 12.0 1700 15 14.0 2190 22 6.5 870 22 8.5 1450 22 10.5 1970 22 12.0 2450 29 5.5 110 29 7.0 210 29 9.0 400 29 11.0 500 Graph the data in the table linked in the description above. (Hint: You must identify the dependent variable and two independent variables.) You may complete your graph electronically or by hand (then take a photo of your graph). Upload your photo or electronic file. (COMPLETE IN ONE GRAPH).A student used multiple regression analysis to study how family spending (y) is influenced by income (x1), family size (x2), and additions to savings (x3). The variables y, x1, and x3 are measured in thousands of dollars. The following results were obtained. ANOVA df SS Regression 3 45.9634 Residual 11 2.6218 Total Coefficients Standard Error Intercept 0.0136 x1 0.7992 0.074 x2 0.2280 0.190 x3 -0.5796 0.920 Write out the estimated regression equation for the relationship between the variables. Compute coefficient of determination. Can you interpret the strength of the relationship? Carry out a test to determine whether y is significantly related to the independent variables. Use a 5% level of significance. Carry out a test to see if x3 and y are significantly related. Use a 5% level of significance.A student used multiple regression analysis to study how family spending (y) is influenced by income (x1), family size (x2), and additions to savings (x3). The variables y, x1, and x3 are measured in thousands of dollars. The following results were obtained. ANOVA df SS Regression 3 45.9634 Residual 11 2.6218 Total Coefficients Standard Error intercept 0.0136 x1 0.7992 0.074 x2 0.2280 0.190 x3 -0.5796 0.920 Write out the estimated regression equation for the relationship between the variables. Compute coefficient of determination. What can you say about the strength of this relationship? Carry out a test to determine whether y is significantly related to the independent variables. Use a 5% level of significance. Carry out a test to see if x3 and y are significantly related. Use a 5% level of significance.

