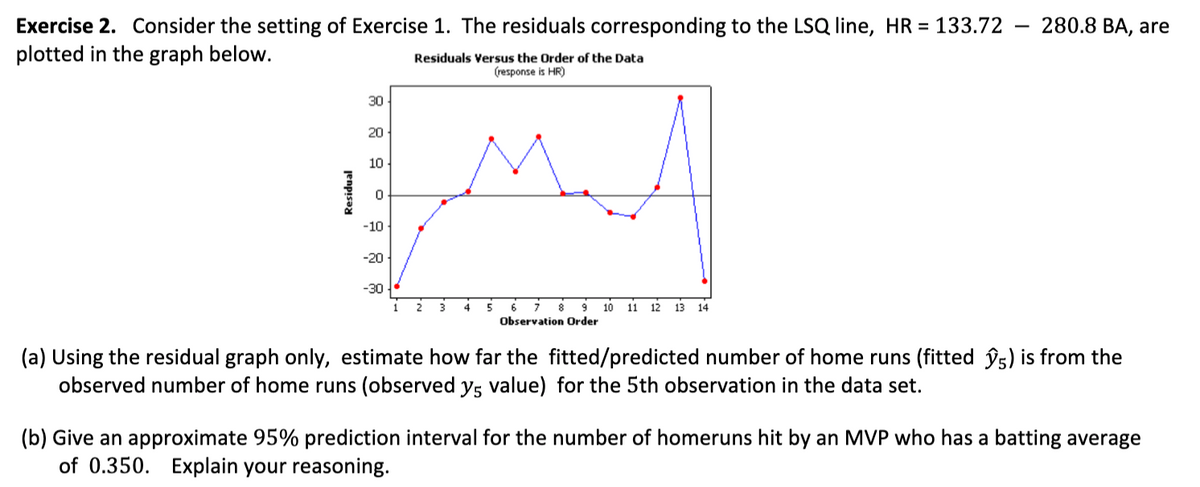
Consider the setting of Exercise 1. The residuals corresponding to the LSQ line, HR = 133.72 – 280.8 BA, are he graph below. Residuals Versus the Order of the Data (response is HR) 30 20 10


Q: Consider the following pairs of measurements. 5 3 - 2 7 4 y 4 1 7 4 3 a. Construct a scatterplot of…
A: Scatterplot for y and x Software Procedure: Step-by-step software procedure to draw scatter plot…
Q: Given the data, find the following: 1. To solve for the 6th decile, the lower boundary to use is:…
A: Since you have posted a question with multiple sub-parts, we will solve first three subparts for…
Q: Q4 As a factory manager, you are concem about the health of your workers. In this regard, you have…
A: Q4. Let x be the working temperature and y be the water consumption. The scatter plot is obtained…
Q: Scores on an accounting exam ranged from 45 to 94. with quartiles Q1= 52.00. Q2=56.5, and Q3= 7775.…
A: a) Given Data: Range=45 to 94 Q1=52 Q2=56.5 Q3=77.75 Box Plot A represents the data correctly…
Q: Calculate the value of r and test if there is a significant relationship between age of persons and…
A: Solution: X Y (X-X) (Y-Y) (X-X)2 (Y-Y)2 (X-X)(Y-Y) 11 40 -4.5 -4.4 20.25 19.36 19.8 12 42…
Q: Can a low barometer reading be used to predict maximum wind speed of an approaching tropical…
A: In this question we have the data, using which we have to plot the scatter plot and best line of…
Q: Consider the following data points: r|-1 0 0 2 2 y-1 0 1 1 2 Find the best-fit line y = a+ Bx for…
A: note : As per our company guidelines we are supposed to answer ?️only the first question. Kindly…
Q: The following regression output is for predicting the heart weight (in g) of cats from their body…
A: Given, R2=64.66%=0.6466 Coefficient of determination that is R square is the square of correlation…
Q: Based on the data shown below, calculate the regression line (each value to two decimal places) y…
A:
Q: Fit a straight line to the following data and estimate the production in the year 1957. YEAR:…
A:
Q: In the following data, xx is the average number of hours the student spent working on math each week…
A: Here the regression line is given. We have to predict the grade from the number of hours studied. x…
Q: The following data represent the muzzle velocity (in feet per second) of rounds fired from a…
A: Given: n=6 α=0.01
Q: In the following data, x is the average number of hours the student spent working on math each week…
A:
Q: The following data represent the muzzle velocity (in feet per second) of rounds fired from a 155-mm…
A: “Since you have posted a question with multiple sub-parts, we will solve first three subparts for…
Q: 5. Fit the following data in a linearly regressed line. Find the co-efficient of variation. x, cm 2…
A:
Q: The price X (dollars per pound) and consumption y (in pounds per capita) of beef were samples for 10…
A: Given Information
Q: Draw a scatter diagram for the data and determine by inspection if there exists an approximate…
A: Construct the scatter plot Use EXCEL to obtain the scatter plot. EXCEL procedure: Go to EXCEL…
Q: For the data set below, use the graph to determine if 2. 3. 9.1 16.2 35.4 77.2 94 4 AYIS…
A: Given data set is
Q: The following information is obtained from a sample data set. = 12. x = 42, y = 564, xy = 570, = 186…
A:
Q: The following data represent the muzzle velocity (in feet per second) of rounds fired from a 155-mm…
A: It was stated that the following data represent the muzzle velocity (in feet per second) of rounds…
Q: Use the second curve fitting criterion to minimize the sum of absolute deviations for the model y =…
A:
Q: For Exercise, use the given data to find a variation model relating y to x. B х 2 12 48 2 У 0.25
A: Variation: Variation problems involves simple relationships or formulas, involving one variable…
Q: Use the data and prediction equation given below to calculate the residual when X= 7. Y_hat = 19 +…
A:
Q: Answer the question below by clicking on the correct response. y 50 40 30 20 10- 0+ 4 8 10 12 The…
A: equation of line passing through two points ( x1 , y1) and (x2, y2) y= y1 = y2-y1x2-x1(x-x1)
Q: In the following data, x is the average number of hours the student spent working on math each week…
A:
Q: 15 From the data given below find out the value of Y when X=35 10 20 30 40 Y 50 60 70 90 joL
A:
Q: The following table shows the distribution of the maximum loads in short tons supported by certain…
A: Maximum load No. of cables Cumulative frequency 9.3-9.7 2 2…
Q: In the following data, x is the average number of hours the student spent working on math each week…
A: x= average number of hours on each week y=final grade in math
Q: I. Direction: Answer the following problem. 1. Using the following data, perform a one way t-test…
A: Note: If the post contains multiple questions only allow to do first question as per guidelines of…
Q: The price X (dollars per pound) and consumption y (in pounds per capita) of beef were samples for 10…
A: From the provided information,
Q: Plot the following data using proper graphing techniques. (Hint: P depends on T) Temperature…
A: as per guidelines, we can only do a maximum 3 part of the question if you want all please ask them…
Q: The table below² shows the median monthly rent (in January) for a one-bedroom apartment in the Hyde…
A:
Q: Given are five observations for two variables, x and y. I| 3 12 6 20 14 y. | 55 40 55 10 15 a.…
A:
Q: The following data define the sea-level concentration of dissolved oxygen, O in mg/L for fresh water…
A: Given DataT⋅C243240O,mS/L°8.4187.3056.413a) We know that formula for linear interpolation isy=y1 +…
Q: 5) Determine whether the relationships represented in the tables are linear. If so, calculate the…
A:
Q: Consider the following release data for a drug in water Time Q (Cumulative amount released in (min)…
A: Explanation: Simple linear regression eqution: Y = a + bX Where, Y is dependent variable X is…
Q: Given the bivariate data: 3 5 7 5 3 2 1 a. Draw a scatter diagram for the data. b. Find n,,, and .…
A: Given:
Q: Hello. How do you calculate this question on a TI-83? Thanks.
A: SolutionThe TI-83 does not give the standard error of the regression slope directly. The regression…
Q: The population proportion for a certain characteristic is 0.38. In a sample of 100 people, 35 had…
A: Denote p as the true proportion.
Q: Q.3. The annual precipitation data (mm) recorded at Kumköy, Istanbul in period 1952-1990 are given…
A: Hello. Since your question has multiple sub-parts, we will solve first three sub-parts for you. If…
Q: Is the magnitude of an earthquake related to the depth below the surface at which the quake occurs?…
A: (a) Scatter diagram of the data:The line that best fits the data is least-squares regression…
Q: Q.3. The annual precipitation data (mm) recorded at Kumköy, Istanbul in period 1952-1990 are given…
A: Since you have posted a question with multiple sub-parts, we will solve first three subparts for…
Q: The power of the slope t-test is NOT determined by: A)direction of slope B) sample size C)…
A: To calculate power of the slope t-test, we need sample size, effect size and alpha. Direction of…
Q: The following scatter plot has a linear relationship. O True O False
A: Explanation of the answer is as follows
Q: Is the magnitude of an earthquake related to the depth below the surface at which the quake occurs?…
A: The correlation explains the strength of association between two variable. It is calculated using…
Q: The data below are the termperatures on randomly chosen days during a summer class and the number of…
A: Solution-: Let, X=Temperature and Y=Number of absences We have following table: X Y 72 3 85 7…
Q: study is made of the relationship between annual production volume of Good A and factory floor area.…
A:
Q: For the following scores, Y 4 2 9 1 6 1 9 a. Sketch a scatter plot and estimate the Pearson cor-…
A: We have given that two random variables X and Y each of sample size 4.
Q: Given the data as shown in the table below X Y 2 12 3 10 4 9 10 Use technology to graph the…
A: As it is mentioned to use technology, I am using MS Excel and will provide all the steps.
Q: d. Draw the regression line on the scatter diagram using the yp points.e. Find y for x = 50 x 20…
A: Given data x y 20 20 10 20 30 30 40 50 60 60 70 80…


Trending now
This is a popular solution!

Step by step
Solved in 3 steps

- A manufacturer producing cocacola drinks wanted to set the specification of production to achieve process capability. He set his Upper Control Limit (UCL) = 0.03, proportion of defective items as 0.02. Calculate the number of sample observations (n) to be used to ensure 99.74 of the value.A worker with a weight of 65 kg and a body surface area of 1.74 , performs physical work activities in several work environments as shown in the following table. The work activities of these workers require energy and a measured metabolic rate of 400 W/m2. During their work activities, the worker wears a coverall made of polyolefin and wears a headgear (1) Calculate the average WBGT of the work environment. (2) Perform an analysis related to the heat stress experienced by the worker, if the worker performs his work activities for 75% of his total working time and the rest is rest, (note: use TLV from ACGIH and ISO 7243)In response to concerns about nutritional contents of fast foods, McDonald’s announced that it would use a new cooking oil for its french fries that would decrease substantially trans fatty acid levels and increase the amount of more beneficial poly-unsaturated fat. The company claimed that 97 out of 100 people cannot detect a difference in taste between the new and old oils. Assuming that this figure is correct (as a long-run proportion). Let X denote the number of individuals who can taste the difference between the two oils in a random sample of 1000 individuals who have purchased fries at McDonald’s. If it turns out that 65 individuals in the sample can taste the difference between the two oils, would you question McDonald’s claim? Explain why or why not.
- In response to concerns about nutritional contents of fast foods, McDonald’s announced that it would use a new cooking oil for its french fries that would decrease substantially trans fatty acid levels and increase the amount of more beneficial poly-unsaturated fat. The company claimed that 97 out of 100 people cannot detect a difference in taste between the new and old oils. Assuming that this figure is correct (as a long-run proportion). Let X denote the number of individuals who can taste the difference between the two oils in a random sample of 1000 individuals who have purchased fries at McDonald’s Find the Distribution of X.In response to concerns about the nutritional contents of fast foods, McDonald’s announced that it would use new cooking oil for its french fries that would decrease substantially trans fatty acid levels and increase the amount of more beneficial poly-unsaturated fat. The company claimed that 97 out of 100 people cannot detect a difference in taste between the new and old oils. Assuming that this figure is correct (as a long-run proportion). Let X denote the number of individuals who can taste the difference between the two oils in a random sample of 1000 individuals who have purchased fries at McDonald’s. Use the normal approximation with continuity correction to find the probability that at most 5% can taste the difference between the two oils.A survey of 28 employed workers found that the correlation coefficient between the number of years of post-secondary education and current annual income in dollars is -0.38. The researchers hypothesize a positive relationship between number of years of post-secondary education and annual income. What can the researchers conclude with α = 0.05? a) Obtain/compute the appropriate values to make a decision about H0. critical value= test statistic= b) effect size= C) 1)There is a significant positive relationship between years of post-secondary education and current annual income. 2)There is a significant negative relationship between years of post-secondary education and current annual income. 3) There is no significant relationship between years of post-secondary education and current annual income.
- A tax accountant would like to test the claim that the proportion of individuals who owe when filing their taxes is less than 0.20. If the z− test statistic was calculated as z=−2.11, does the tax accountant have enough evidence to reject the null hypothesis? Assume α=0.005. Move the blue dot to choose the appropriate test (left-, right, or two-tailed). Then, use the graph below to show the test statistic, p-value, and the rejection region to make a conclusion about the hypothesis test. powered by Move the blue dot to choose the appropriate test α=0.01 α=0.025 α=0.05 α=0.1 Significance level = 0.01 Select the correct answer below: There is enough evidence to suggest the proportion of individuals who owe when filing their taxes is less than 0.20. There is not enough evidence to suggest the proportion of individuals who owe when filing their taxes is less than 0.20. There is enough evidence to suggest the proportion of individuals who owe when filing their taxes is greater than 0.20.…a sample of 4 students was taken and information about daily pocket money in tl (Y) and spending in tl (x) was collectedA series of tests of fire prevention sprinkler systems that use a foaming agent to quell the fire were performed to determine how long it took (in seconds) for the sprinklers to be activated after the detection of a fire by the system. The system has been designed so that the true average activation time is supposed to be at most 25 seconds. Do the data strongly indicate that the design specifications have not been met? The data for the test are given below: 27 41 22 27 23 35 30 33 24 27 28 22 24
- A researcher interested in exercise endurance in older adults with coronary heart disease measured the endurance of 450 older adults during an exercise routine on a scale of 0-10. He obtained a mean (SD) rating of 6.2 (3.4). Compute the 85% C. I: _____________.In a sample of 14 randomly selected high school seniors, the mean score on a standardized test was 1197 and the standard deviation was 164.9. Further research suggests that the population mean score on this test for high school seniors is 1022. Does the t-value for the original sample fall between - to 95 and to o5? Assume that the population of test scores for high school seniors is normally distributed. The t-value of t= V fall between - to 95 and to 95 because to g5 =. (Round to two decimal places as needed.)Here sample 10 people in a high school to try to predict GPA in 10th grade from GPA in 9th grade. here determine that SSE = 5.8. Compute the standard error of the estimate?