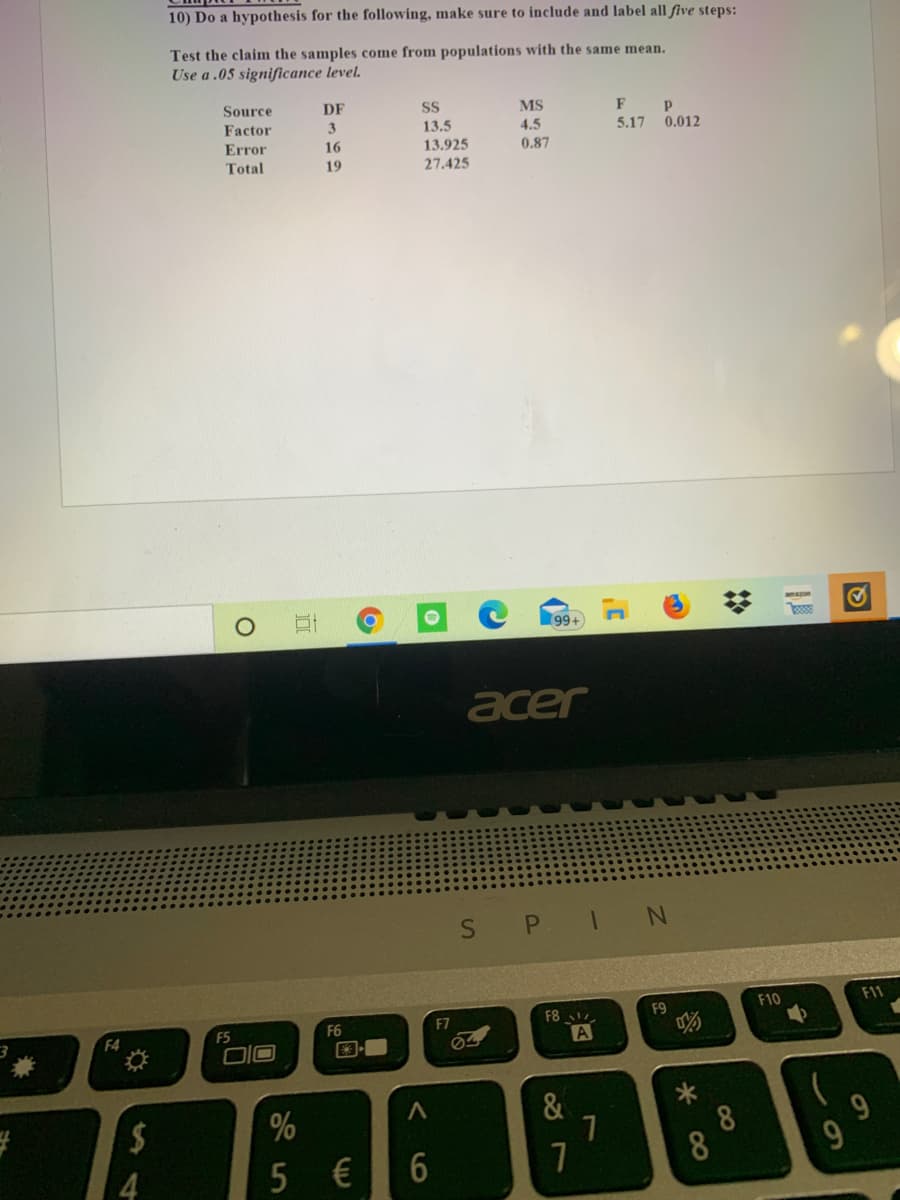
Test the claim the samples come from populations with the same mean. Use a.05 significance level. Source DF SS 13.5 13.925 27.425 MS Factor 3 4.5 5.17 0.012 Error 16 0.87 Total 19


Q: Use the standard normal table to find the z-score that corresponds to the given percentile. If the…
A:
Q: Researchers conducted a study to determine whether magnets are effective in treating back pain. The…
A: From the provided information,
Q: You are interested in people’s opinion about an upcoming local political election. You poll people…
A: In the given scenario, the number of counts for indicating the vote for Candidate A or Candidate B…
Q: counted as they came off a production line. The results can be summarized as follows: TT No. of…
A: Here, x Frequency Cumulative Frequency 0 57 57 1 57 114 2 18 132 3 5 137 4 3 140 (i)…
Q: What is your statistical decision? A researcher is interested in the effect of employment on life…
A: Given : Employed Full time(1) Employed Part time(2) Temporarily Unemployed(3) Chronically…
Q: Sample size 9 whose data are given below is drawn from a population having a mean = 8 and standard…
A: Solution-: We have, n=9,μ=8,σ=5 To obtain the standard deviation of the sampling distribution=?
Q: These are scores from a following test: 3, 5, 8, 6, 7, 7, 10, 7, 9, 8 Find the following: A)…
A: “Since you have posted a question with multiple sub-parts, we will solve first three sub-parts for…
Q: Using Excel, using the procedures and formulas for ANOVA to check if the Population Means for…
A: Given: The flying time before major maintenance for three types of aircraft. The significance level…
Q: Listed below are ages of actresses and actors at the time that they won an award for the categories…
A:
Q: You may need to use the appropriate appendix table or technology to answer this question. Consider…
A: Hey, there! Since there are more than three sub-parts posted, we will answer first three sub-parts…
Q: The weekly number of emergency calls to a dentist office over a 5 week period is given below: 7, 3,…
A:
Q: The grade point averages (GPA) of 15 randomly selected college students are 2.3, 3.3, 2.6, 1.8, 0.2,…
A:
Q: Treatment II III n= 5 n= 5 M - 1 M = 5 M = 6 N = 15 T - 5 T - 25 Т -30 G - 60 3 = 9.00 s = 10.00 s =…
A: ANOVA one way classification problem. Comparison of various treatment effects.
Q: Home Ownership Rates The percentage rates of home ownership for 7 randomly selected states are…
A: INTRODUCTION: confidence interval for variance of the normal distribution when n is small and also…
Q: (d) TRUE or FALSE? It is possible for an MVUE to be biased. (e) TRUE or FALSE? The sample mean is…
A: Hi! Thank you for the question, As per the honor code, we are allowed to answer three sub-parts at a…
Q: do online students perform differently than students in a traditional classroom? Las semester there…
A: From the provided information, The claim is that there is a difference in the average exam scores…
Q: You conduct a survey and receive the following scores from your participants: 7, 4, 1, 2, 5, 4, 5,…
A: As per company guidelines I solved exactly three subparts of the question . thank you
Q: We know that the mean weight of men is greater than the mean weight of women, and the mean height of…
A:
Q: 9.3 3
A: The hypotheses are given below:
Q: Determine whether the following statement is true or false. If it is false, rewrite it as a true…
A: Given statement:A sample statistic will not change from sample to sample
Q: 3. The breaking strengths of 35 pieces of cotton thread are measured. The sample mean is x = 974.3…
A:
Q: The number of daily proposals received by a developing country's government from enterprises…
A: The total number of observations in the population list N = 15 The list of the observations: 2 3…
Q: 2. To increase the Power of a test: I. Increase the Significance Level. Decrease the sample size.…
A:
Q: A TIRE MANUFACTURER WANTS TO DETERMINE THE INNER DIAMETER OF A CERTAIN GRADE OF TIRE. IDEALLY, THE…
A: Here, Frequency: number of times an event occurred in an experiment (absolute frequency). Histogram:…
Q: Listed below are ages of actresses and actors at the time that they won an award for the categories…
A: Given : The age of actresses and actors at the time that they won an award for the categories of…
Q: You may need to use the appropriate appendix table or technology to answer this question. Consider…
A:
Q: Using the data (provided below this question) test the hypotheses that the mean difference in…
A: In this case, it is appropriate to apply paired t test. Using EXCEL, the paired t-test is applied.…
Q: How large is a wolf pack? The following information is from a random sample of winter wolf packs.…
A: From the provided information, The data values are as follow: 1, 9, 6, 4, 6, 6, 1, 3, 2, 12, 2, 14,…
Q: You own two small gift shops, one in City A and one in City B. You are interested in which city…
A: Given that we own two small gift shops, one in city A and one in city B. we are interested in which…
Q: BMI We know that the mean weight of men is greater than the mean weight of women, and the mean…
A: The provided data is,
Q: Listed below are ages of actresses and actors at the time that they won an award for the categories…
A:
Q: Magnet Problem Researchers conducted a study to determine whether magnets are effective in treating…
A: From the provided information,
Q: Using the data below (assume the data comes from a population) 5,8,14,6,21,11,9,10,18,2 A.…
A: Hello. Since your question has multiple sub-parts, we will solve first three sub-parts for you. If…
Q: The grade point averages (GPA) of 15 randomly selected college students are 2.3, 3.3, 2.6, 1.8, 0.2,…
A: Solution: x (x-x) (x-x)2 2.3 -0.0533 0.0028 3.3 0.9467 0.8962 2.6 0.2467 0.0609 1.8…
Q: (b) Determine the mean and standard deviation of the sample data. The mean of the sample data is…
A: Given Information:
Q: John is interested in the number of children per household for house-holds in Tyler, TX. He conducts…
A: Note: Hi there! Thank you for posting the question. As there are multiple sub parts, according to…
Q: Use the Minitab display to test the claims. Use the α=0.05 significance level. The sample data are…
A:
Q: The "cold start ignition time" of an automobile engine is being investigated by a gasoline…
A: From the provided information, The data values are as follow: 1.60, 1.93, 2.66, 2.31, 3.05, 3.22,…
Q: Test the claim about the population mean, μ, at the given level of significance using the given…
A: Given,x=28.8σ=3.64n=80claim:μ=30α=0.06
Q: kshe The height of women ages 20-29 is normally distributed, with a mean of 64.6 inches. Assume o =…
A: Obtain the probability of randomly selecting 1 woman with a height less than 66.4 inches. The…
Q: Home Ownership Rates The percentage rates of home ownership for 8 randomly selected states are…
A: Mean is the measure which use to determine the central measure. It is calculated by averaing all the…
Q: a. Mean family size of the sample: b. Sample variance: ct Test Value: d. Summarize your…
A: a. The mean family size of the sample is, x¯=∑xn=4+4+9+8+4+8+97=6.5714 Thus, the mean family size of…
Q: A coach uses a new technique to train gymnasts. Seven gymnasts were randomly selected, and the…
A: Given information Seven gymnasts were selected and scores were recorded before and after the…
Q: Home Ownership Rates The percentage rates of home ownership for 6 randomly selected states are…
A: Given: sample size n = 6 Formula Used: Sample variance S2 = ∑Xi-X2n-1 Sample standard deviation S…
Q: Sample Data: 70, 75, 75, 80. 80, 96, 100 a. Mean: b. Median: c. Mode: d. Range e Sample Standard…
A: Given data is 70,75,75,80,80,96,100sample size(n)=7
Q: Recreational Time A researcher wishes to see if there is a difference between the mean number of…
A: Given:
Q: Use technology to help you test the claim about the population mean, µ, at the given level of…
A: Consider that μ is the true mean.
Q: Use the standard normal table to find the z-score that corresponds to the given percentile. If the…
A:
Q: Test the claim about the population mean, μ, at the given level of significance using the given…
A: From the given information, Sample size n =76 Sample mean, x̅=29.5 Population standard deviation, σ…


Step by step
Solved in 2 steps with 1 images


- What is meant by the sample space of an experiment?Kevin, a Human Resources professional, would like to make the claim that the average hourly wage for administrative workers at his company is less than $9.69. Kevin samples 15 workers and obtains a sample mean of $8.80 per hour. At the 1% significance level, should Kevin reject or fail to reject the null hypothesis given the sample data below?The use of cellular phones in automobiles has increased dramatically in the last few years. Of concern to traffic experts, as well as to manufacturers of cellular phones, is the effect on accident rates. Is someone who is using a cellular phone more likely to be involved in a traffic accident? What is your conclusion from the following sample information? Use the 0.05 significance level. Had Accident in the Last Year Did Not Have an Accident in the Last Year Uses a cell phone 47 320 Does not use a cell phone 42 221 State the null hypothesis (Choose 1 or 2.) (Choose 1 or 2) There is no relationship between phone use and accidents.2. There is a relationship between phone use and accidents. State the decision rule using 0.05 significance level.(Round your answer to 3 decimal places.) Reject H0 if chi square is greater than Compute the value of chi-square.(Round your answer to 3 decimal places.) What is your decision regarding H0? (Choose…
- The use of cellular phones in automobiles has increased dramatically in the last few years. Of concern to traffic experts, as well as to manufacturers of cellular phones, is the effect on accident rates. Is someone who is using a cellular phone more likely to be involved in a traffic accident? What is your conclusion from the following sample information? Use the 0.05 significance level. Had Accident in the Last Year Did Not Have an Accident in the Last Year Uses a cell phone 33 271 Does not use a cell phone 51 424 Click here for the Excel Data File H0: There is no relationship between phone use and accidents.H1: There is a relationship between phone use and accidents. a. State the decision rule using 0.05 significance level. (Round your answer to 3 decimal places.) b. Compute the value of chi-square. (Round your answer to 3 decimal places.)2. A national car rental agency is interested in determining whether the mean days that customers rent cars is the same between three of its major cities. The following data reflect the number of days people rented a car for a sample of people in each of three cities. At the 5% significance level, do the data provide sufficient evidence to conclude that a difference exists between the population mean days corresponding to the three cities? Use the One-Way ANOVA test. -Attached is the image with the following data. Step 1 - State the Hypothesis Step 2 - Decide on alpha Step 3 - Calculate the Test Statistic Step 4 - Find the Critical Value Step 5 - ConclusionAt the 0.05 significance level, can we conclude that the mean amount spent has increased? Follow the five step hypothesis testing procedure.
- An information technology help desk has a service level agreement (SLA) that says that clients should be contacted about their service requests within 1 hour (60 minutes) of the help desk receiving the request. Jackie, the help desk manager, wants to check if the help desk is actually taking longer than 60 minutes to respond. For a random sample of 20 service requests, Jackie obtained the time between the help desk receiving the request and the client being contacted. The marketer conducts a one-mean hypothesis at the 5% significance level, to test whether the response time is greater than 60 minutes. (a) Which answer choice shows the correct null and alternative hypotheses for this test? Select the correct answer below: H0:μ=20; Ha:μ<20, which is a left-tailed test. H0:μ=60; Ha:μ<60, which is a left-tailed test. H0:μ=20; Ha:μ>20, which is a right-tailed test. H0:μ=60; Ha:μ>60, which is a right-tailed test.Listed below are attribute ratings of males by females who participated in speeddating events. Use a 0.05 significance level to test the claim that females in thedifferent age brackets give attribute ratings with the same mean. Does ageappear to be a factor in the female attribute ratings? (Write the null andalternative hypothesis in symbols, find the critical value and test statistics,make a decision, and write a conclusion based on your results and answer thequestion above.)Age 20-22 38 42 30.0 39 47 43 33 31 32 28Age 23-26 39 31 36.0 35 41 45 36 23 36 20Age 27-29 36 42 35.5 27 37 34 22 47 36 32In a rural area, only 30% of the wells that are drilled find adequate water within a depth of 100 feet or less. A local man Jed Clampett asserts he can do better by “dowsing” - using a forked stick to indicate where the well should be drilled. A sample of 80 of his customers reported 27 that found water before a depth of 100 feet. Does the data support his claim? Use a 10% significance level.
- A pipes manufacturer makes pipes with a length that is supposed to be 19 inches. A quality control technician sampled 24 pipes and found that the sample mean length was 19.08 inches and the sample standard deviation was 0.24 inches. The technician claims that the mean pipe length is not 19 inches. What type of hypothesis test should be performed? What is the test statistic? What is the number of degrees of freedom? Does sufficient evidence exist at the α=0.01 significance level to support the technician's claim?As part of a study of corporate employees, the director of human resources for PNC Inc. wants to compare the distance traveled to work by employees at its office in downtown Cincinnati with the distance for those in downtown Pittsburgh. A sample of 35 Cincinnati employees showed they travel a mean of 370 miles per month. A sample of 40 Pittsburgh employees showed they travel a mean of 380 miles per month. The population standard deviations for the Cincinnati and Pittsburgh employees are 30 and 26 miles, respectively. At the .05 significance level, is there a difference in the mean number of miles traveled per month between Cincinnati and Pittsburgh employees?A grassroots group opposed to a proposed increase in the gas tax claimed that the increase would hurt working-class people the most, since they commute the farthest to work. Suppose that the group randomly surveyed 24 individuals and asked them their daily one-way commuting mileage. The results are in Table below. Using a 5% significance level, test the hypothesis that the three mean commuting mileages are the same. working-class professional (middle incomes) professional (wealthy) 17.8 16.5 8.5 26.7 17.4 6.3 49.4 22.0 4.6 9.4 7.4 12.6 65.4 9.4 11.0 47.1 2.1 28.6 19.5 6.4 15.4 51.2 13.9 9.3