Test the hypothesis using the P-value approach. Be sure to verify the requirements of the test. Ho: p=0.88 versus H₁: p=0.88 n=500, x=430, α = 0.05 p= 0.86 (Type an integer or a decimal. Do not round.) Find the test statistic Zo Zo= = -1.38 (Round to two decimal places as needed.) Find the P-value. P-value= (Round to three decimal places as needed.)
Test the hypothesis using the P-value approach. Be sure to verify the requirements of the test. Ho: p=0.88 versus H₁: p=0.88 n=500, x=430, α = 0.05 p= 0.86 (Type an integer or a decimal. Do not round.) Find the test statistic Zo Zo= = -1.38 (Round to two decimal places as needed.) Find the P-value. P-value= (Round to three decimal places as needed.)

Algebra & Trigonometry with Analytic Geometry
13th Edition
ISBN:9781133382119
Author:Swokowski
Publisher:Swokowski
Chapter10: Sequences, Series, And Probability
Section10.8: Probability
Problem 10E

Related questions
Question
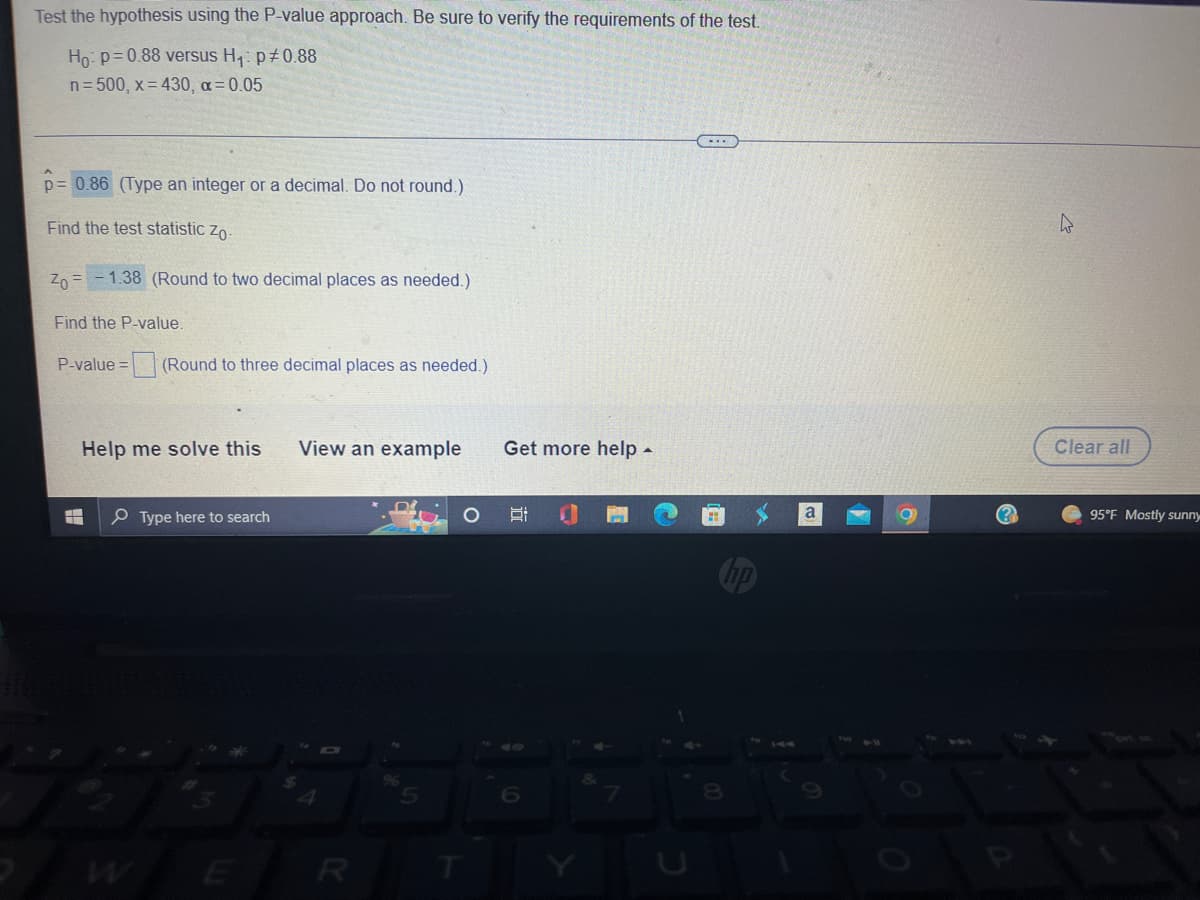
Transcribed Image Text:Test the hypothesis using the P-value approach. Be sure to verify the requirements of the test.
Ho: p=0.88 versus H₁: p0.88
n=500, x=430, α = 0.05
-...
p= 0.86 (Type an integer or a decimal. Do not round.)
Find the test statistic Zo-
Zo=1.38 (Round to two decimal places as needed.)
Find the P-value.
P-value= (Round to three decimal places as needed.)
Help me solve this View an example
Type here to search
O
T
R
Get more help.
E
6
(2
4
8
(?
4
Clear all
95°F Mostly sunny
Expert Solution
This question has been solved!
Explore an expertly crafted, step-by-step solution for a thorough understanding of key concepts.

This is a popular solution!

Trending now
This is a popular solution!

Step by step
Solved in 8 steps with 1 images

Recommended textbooks for you
Algebra & Trigonometry with Analytic Geometry
Algebra
ISBN:
9781133382119
Author:
Swokowski
Publisher:
Cengage
Algebra & Trigonometry with Analytic Geometry
Algebra
ISBN:
9781133382119
Author:
Swokowski
Publisher:
Cengage