You are a researcher who is interested in how watching television influences children's performance in school. You find out how many hours of television 5 children watch, on average, in a week. You have obtained their overall grade average. Child No. Hours of TV Overall Grade Average 1 5 80 2 20 67 3 6 75 4 14 70 5 12 80 a. Calculate the correlation between hours of television watched and overall grade average. Interpret the correlation - what does it mean? b. Calculate the regression equation (use television watching to predict grade). c. Make a scatter plot of the data and draw the line of best fit on your scatter plot.
You are a researcher who is interested in how watching television influences children's performance in school. You find out how many hours of television 5 children watch, on average, in a week. You have obtained their overall grade average. Child No. Hours of TV Overall Grade Average 1 5 80 2 20 67 3 6 75 4 14 70 5 12 80 a. Calculate the correlation between hours of television watched and overall grade average. Interpret the correlation - what does it mean? b. Calculate the regression equation (use television watching to predict grade). c. Make a scatter plot of the data and draw the line of best fit on your scatter plot.

Glencoe Algebra 1, Student Edition, 9780079039897, 0079039898, 2018
18th Edition
ISBN:9780079039897
Author:Carter
Publisher:Carter
Chapter4: Equations Of Linear Functions
Section4.5: Correlation And Causation
Problem 15PPS

Related questions
Question
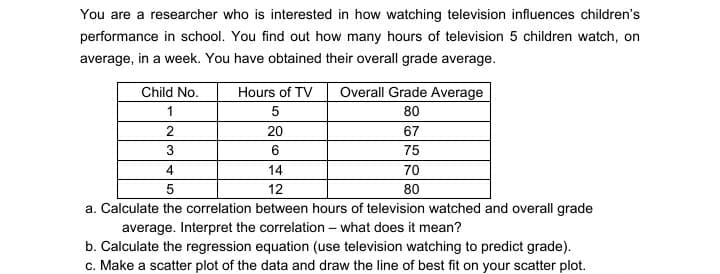
Transcribed Image Text:You are a researcher who is interested in how watching television influences children's
performance in school. You find out how many hours of television 5 children watch, on
average, in a week. You have obtained their overall grade average.
Child No.
Hours of TV
Overall Grade Average
1
5
80
2
20
67
3
6
75
4
14
70
5
12
80
a. Calculate the correlation between hours of television watched and overall grade
average. Interpret the correlation - what does it mean?
b. Calculate the regression equation (use television watching to predict grade).
c. Make a scatter plot of the data and draw the line of best fit on your scatter plot.
Expert Solution
This question has been solved!
Explore an expertly crafted, step-by-step solution for a thorough understanding of key concepts.

This is a popular solution!

Trending now
This is a popular solution!

Step by step
Solved in 2 steps with 3 images

Recommended textbooks for you
Glencoe Algebra 1, Student Edition, 9780079039897…
Algebra
ISBN:
9780079039897
Author:
Carter
Publisher:
McGraw Hill

Big Ideas Math A Bridge To Success Algebra 1: Stu…
Algebra
ISBN:
9781680331141
Author:
HOUGHTON MIFFLIN HARCOURT
Publisher:
Houghton Mifflin Harcourt

Algebra and Trigonometry (MindTap Course List)
Algebra
ISBN:
9781305071742
Author:
James Stewart, Lothar Redlin, Saleem Watson
Publisher:
Cengage Learning
Glencoe Algebra 1, Student Edition, 9780079039897…
Algebra
ISBN:
9780079039897
Author:
Carter
Publisher:
McGraw Hill
Big Ideas Math A Bridge To Success Algebra 1: Stu…
Algebra
ISBN:
9781680331141
Author:
HOUGHTON MIFFLIN HARCOURT
Publisher:
Houghton Mifflin Harcourt
Algebra and Trigonometry (MindTap Course List)
Algebra
ISBN:
9781305071742
Author:
James Stewart, Lothar Redlin, Saleem Watson
Publisher:
Cengage Learning