The following data represent the Calculus grades for a random sample of 10 freshmen at a certain college along with their scores on a FINAL TEST. Student Score, z Calculus, y 1 65 2.7 2 50 3.6 3 55 3.7 4 65 2.5 5 87 1.6 6 77 2.2 7 90 1.3 8 83 1.9 9 48 4.0 10 81 2.0 Compute and interpret the sample correlation coefficient. (b) State necessary assumptions on random variables. (c) Test the hypothesis that p = 0.5 against the alternative that p > 0.5. Use a P-value in the conclusion.
The following data represent the Calculus grades for a random sample of 10 freshmen at a certain college along with their scores on a FINAL TEST. Student Score, z Calculus, y 1 65 2.7 2 50 3.6 3 55 3.7 4 65 2.5 5 87 1.6 6 77 2.2 7 90 1.3 8 83 1.9 9 48 4.0 10 81 2.0 Compute and interpret the sample correlation coefficient. (b) State necessary assumptions on random variables. (c) Test the hypothesis that p = 0.5 against the alternative that p > 0.5. Use a P-value in the conclusion.

Glencoe Algebra 1, Student Edition, 9780079039897, 0079039898, 2018
18th Edition
ISBN:9780079039897
Author:Carter
Publisher:Carter
Chapter10: Statistics
Section10.4: Distributions Of Data
Problem 19PFA

Related questions
Question
Answer with solution and graph
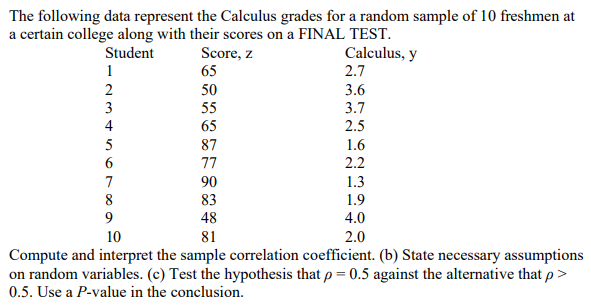
Transcribed Image Text:The following data represent the Calculus grades for a random sample of 10 freshmen at
a certain college along with their scores on a FINAL TEST.
Student
Score, z
Calculus, y
1
65
2.7
2
50
3.6
3
55
3.7
4
65
2.5
5
87
1.6
6
77
2.2
7
90
1.3
8
83
1.9
9
48
4.0
10
81
2.0
Compute and interpret the sample correlation coefficient. (b) State necessary assumptions
on random variables. (c) Test the hypothesis that p = 0.5 against the alternative that p>
0.5. Use a P-value in the conclusion.
Expert Solution
This question has been solved!
Explore an expertly crafted, step-by-step solution for a thorough understanding of key concepts.

Step by step
Solved in 2 steps with 2 images

Recommended textbooks for you
Glencoe Algebra 1, Student Edition, 9780079039897…
Algebra
ISBN:
9780079039897
Author:
Carter
Publisher:
McGraw Hill
Glencoe Algebra 1, Student Edition, 9780079039897…
Algebra
ISBN:
9780079039897
Author:
Carter
Publisher:
McGraw Hill