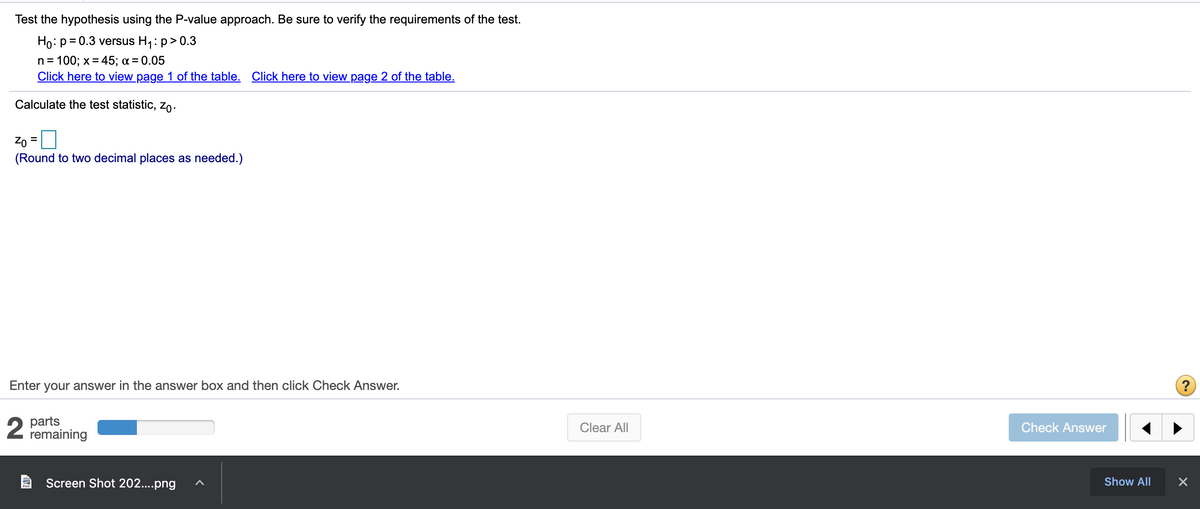
Test the hypothesis using the P-value approach. Be sure to verify the requirements of the test. Ho: p=0.3 versus H,: p>0.3 n= 100; x= 45; a = 0.05 Click here to view page 1 of the table, Click here to view page 2 of the table. Calculate the test statistic, zo- (Round to two decimal places as needed.) Enter your answer in the answer box and then click Check Answer. parts remaining Clear All Check Answer


Hypothesis Testing:
Hypothesis testing is used in statistics to get the better conclusion from the population parameter. If the datasets is huge in size, the statistician might face difficulty to get clear conclusion. In this situation, the statistician can use this hypothesis testing to make the decision clear.
In hypothesis testing, there are different types are there such as null hypothesis and alternative hypothesis. If the hypothesis we calculate is greater than table value, than we should reject the null hypothesis or accept alternative hypothesis. Null hypothesis is denoted by . If the hypothesis we calculate is less than the table value, than we should accept the null hypothesis and reject the alternative hypothesis. Alternative hypothesis is denoted by .

Trending now
This is a popular solution!

Step by step
Solved in 2 steps


