1. While reading a published research report, the following is reported: "When we examined the perceptual skills data, the mean of 12.00 from the sample of 50 adolescents differed significantly from the population mean of 15.00 for adults, [t(49) = 4.8, p<.05]" Find the given N value. 2. What hypothesis testing was performed? I test Z test 3. What aa level was used for the conclusion? 4. What aa level was used for the conclusion? 0.10 0.01 0.05 5. Find TobtTobt from the research conclusion above.(computation is not necessary) 6. Find Tcrit using a T table. 7.What is the result in terms of accepting or rejecting the null hypothesis at \alphaa=0.05? 1/3 8. Can we reject the null hypothesis at \alphaaa of 0.01? Support your conclusion using Tobt and Tcrit 9. Does the sample mean of adolescents differ significantly from the population mean? (Hint: based on your answers on #12) 10. Does the sample mean of adolescents differ significantly from the population mean? (Hint: based on your answers on #12) Yes, because Ho is rejected at 0.01 level of confidence. Yes, because H1 is rejected at 0.01 level of confidence. No, because H1 is rejected at 0.01 level of confidence. No, because Ho is rejected at 0.01 level of confidence.
1. While reading a published research report, the following is reported: "When we examined the perceptual skills data, the mean of 12.00 from the sample of 50 adolescents differed significantly from the population mean of 15.00 for adults, [t(49) = 4.8, p<.05]" Find the given N value. 2. What hypothesis testing was performed? I test Z test 3. What aa level was used for the conclusion? 4. What aa level was used for the conclusion? 0.10 0.01 0.05 5. Find TobtTobt from the research conclusion above.(computation is not necessary) 6. Find Tcrit using a T table. 7.What is the result in terms of accepting or rejecting the null hypothesis at \alphaa=0.05? 1/3 8. Can we reject the null hypothesis at \alphaaa of 0.01? Support your conclusion using Tobt and Tcrit 9. Does the sample mean of adolescents differ significantly from the population mean? (Hint: based on your answers on #12) 10. Does the sample mean of adolescents differ significantly from the population mean? (Hint: based on your answers on #12) Yes, because Ho is rejected at 0.01 level of confidence. Yes, because H1 is rejected at 0.01 level of confidence. No, because H1 is rejected at 0.01 level of confidence. No, because Ho is rejected at 0.01 level of confidence.

Glencoe Algebra 1, Student Edition, 9780079039897, 0079039898, 2018
18th Edition
ISBN:9780079039897
Author:Carter
Publisher:Carter
Chapter4: Equations Of Linear Functions
Section: Chapter Questions
Problem 8SGR

Related questions
Question
Please number the response
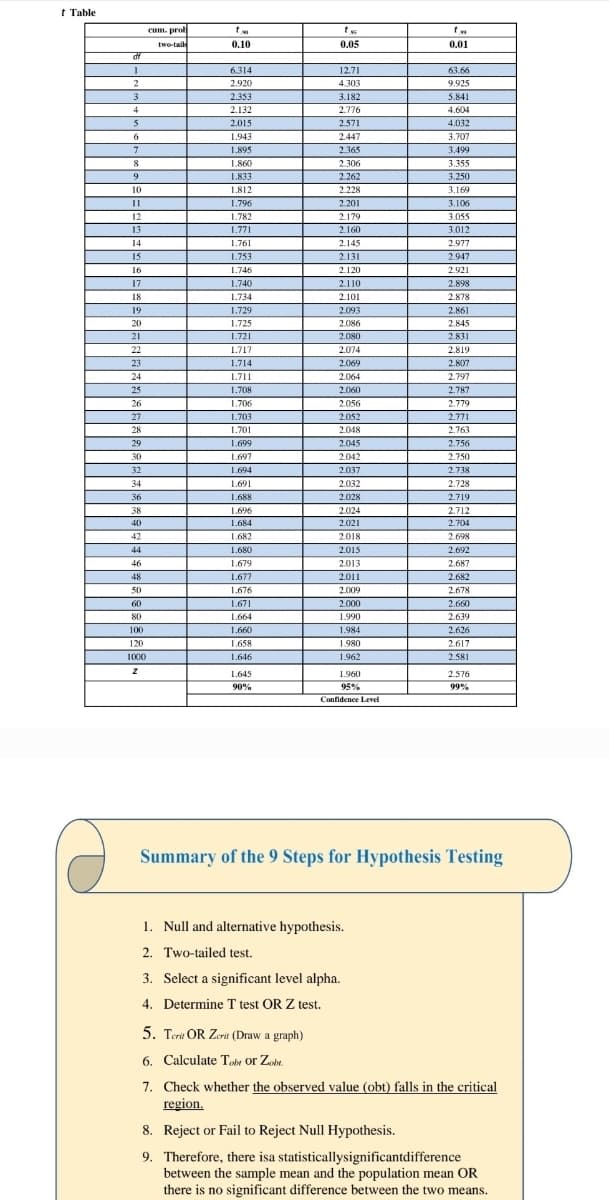
Transcribed Image Text:t Table
cum. prol
two-tail
0.10
0.05
0.01
df
6.314
12.71
63.66
2.920
4.303
9.925
2.353
3.182
5.841
4
2.132
2.776
4.604
5
2.015
2.571
4.032
6.
1.943
2.447
3.707
1.895
2.365
3.499
8
1.860
3.355
3.250
2.306
1.833
2.262
10
1.812
2.228
3.169
1.796
2.201
3.106
12
1.782
2.179
3.055
13
1.771
2.160
3.012
14
1.761
2.145
2.977
15
1.753
2.131
2.947
16
1.746
2.120
2.921
17
1.740
2.110
2.898
18
1.734
2.101
2.878
19
1.729
2.093
2.861
20
1.725
2.086
2.845
21
1.721
2.080
2.831
22
1.717
2.074
2.819
23
1.714
2.069
2.807
24
1.711
2.064
2.797
25
1.708
2.060
2.787
26
1.706
2.056
2.779
27
1.703
2.052
2.771
28
1.701
2.048
2.763
29
1.699
2.045
2.756
30
1.697
2.042
2.750
32
1.694
2.037
2.738
34
1.691
2.032
2.728
36
1.688
2.028
2.719
38
1.696
2.024
2.712
2.704
40
1.684
2.021
42
1.682
2.018
2.698
44
1.680
2.015
2.692
46
1.679
2.013
2.687
48
1.677
2.011
2.682
50
1.676
2.009
2.678
60
1.671
2.000
2.660
80
1.664
1.990
2.639
100
1.660
1.984
2.626
120
1.658
1.980
2.617
1000
1.646
1.962
2.581
1.645
1.960
2.576
90%
95%
99%
Confidence Level
Summary of the 9 Steps for Hypothesis Testing
1. Null and alternative hypothesis.
2. Two-tailed test.
3. Select a significant level alpha.
4. Determine T test OR Z test.
5. Teri OR Zerit (Draw a graph)
6. Calculate Tohy or Zye.
7. Check whether the observed value (obt) falls in the critical
region.
8. Reject or Fail to Reject Null Hypothesis.
9. Therefore, there isa statisticallysignificantdifference
between the sample mean and the population mean OR
there is no significant difference between the two means.
![1. While reading a published research report,
the following is reported: "When we
examined the perceptual skills data, the
mean of 12.00 from the sample of 50
adolescents differed significantly from the
population mean of 15.00 for adults, [t(49) =
4.8, p<.05]"
Find the given N value.
2. What hypothesis testing was performed?
I test
Z test
3. What aa level was used for the conclusion?
4. What aa level was used for the conclusion?
0.10
0.01
0.05
5. Find TobtTobt from the research conclusion
above.(computation is not necessary)
6. Find Tcrit using a T table.
7.What is the result in terms of accepting or
rejecting the null hypothesis at
\alphaa=0.05?
1/3
8. Can we reject the null hypothesis at
\alphaaa of 0.01? Support your conclusion
using Tobt and Tcrit
9. Does the sample mean of adolescents
differ significantly from the population mean?
(Hint: based on your answers on #12)
10. Does the sample mean of adolescents
differ significantly from the population mean?
(Hint: based on your answers on #12)
Yes, because Ho is rejected at 0.01 level of
confidence.
Yes, because H1 is rejected at 0.01 level of
confidence.
No, because H1 is rejected at 0.01 level of
confidence.
No, because Ho is rejected at 0.01 level of
confidence.](/v2/_next/image?url=https%3A%2F%2Fcontent.bartleby.com%2Fqna-images%2Fquestion%2Fb16d438a-6747-410f-961a-8af2d5e6e1f5%2Fc2a9ba9c-e6a0-40a6-865f-8126a30c9b5d%2F54sz2qm_processed.jpeg&w=3840&q=75)
Transcribed Image Text:1. While reading a published research report,
the following is reported: "When we
examined the perceptual skills data, the
mean of 12.00 from the sample of 50
adolescents differed significantly from the
population mean of 15.00 for adults, [t(49) =
4.8, p<.05]"
Find the given N value.
2. What hypothesis testing was performed?
I test
Z test
3. What aa level was used for the conclusion?
4. What aa level was used for the conclusion?
0.10
0.01
0.05
5. Find TobtTobt from the research conclusion
above.(computation is not necessary)
6. Find Tcrit using a T table.
7.What is the result in terms of accepting or
rejecting the null hypothesis at
\alphaa=0.05?
1/3
8. Can we reject the null hypothesis at
\alphaaa of 0.01? Support your conclusion
using Tobt and Tcrit
9. Does the sample mean of adolescents
differ significantly from the population mean?
(Hint: based on your answers on #12)
10. Does the sample mean of adolescents
differ significantly from the population mean?
(Hint: based on your answers on #12)
Yes, because Ho is rejected at 0.01 level of
confidence.
Yes, because H1 is rejected at 0.01 level of
confidence.
No, because H1 is rejected at 0.01 level of
confidence.
No, because Ho is rejected at 0.01 level of
confidence.
Expert Solution
This question has been solved!
Explore an expertly crafted, step-by-step solution for a thorough understanding of key concepts.

This is a popular solution!

Trending now
This is a popular solution!

Step by step
Solved in 3 steps

Recommended textbooks for you
Glencoe Algebra 1, Student Edition, 9780079039897…
Algebra
ISBN:
9780079039897
Author:
Carter
Publisher:
McGraw Hill

College Algebra (MindTap Course List)
Algebra
ISBN:
9781305652231
Author:
R. David Gustafson, Jeff Hughes
Publisher:
Cengage Learning
Glencoe Algebra 1, Student Edition, 9780079039897…
Algebra
ISBN:
9780079039897
Author:
Carter
Publisher:
McGraw Hill
College Algebra (MindTap Course List)
Algebra
ISBN:
9781305652231
Author:
R. David Gustafson, Jeff Hughes
Publisher:
Cengage Learning