Test whether u, <µ2 at the a =0.05 level of significance for the sample data shown in the accompanying table. Assume that the populations are normally distributed. Click the icon to view the data table. Determine the null and alternative hypothesis for this test. O A. Ho:H1 = H2 Sample Data O B. Ho:H1
Test whether u, <µ2 at the a =0.05 level of significance for the sample data shown in the accompanying table. Assume that the populations are normally distributed. Click the icon to view the data table. Determine the null and alternative hypothesis for this test. O A. Ho:H1 = H2 Sample Data O B. Ho:H1

MATLAB: An Introduction with Applications
6th Edition
ISBN:9781119256830
Author:Amos Gilat
Publisher:Amos Gilat
Chapter1: Starting With Matlab
Section: Chapter Questions
Problem 1P

Related questions
Topic Video
Question
100%
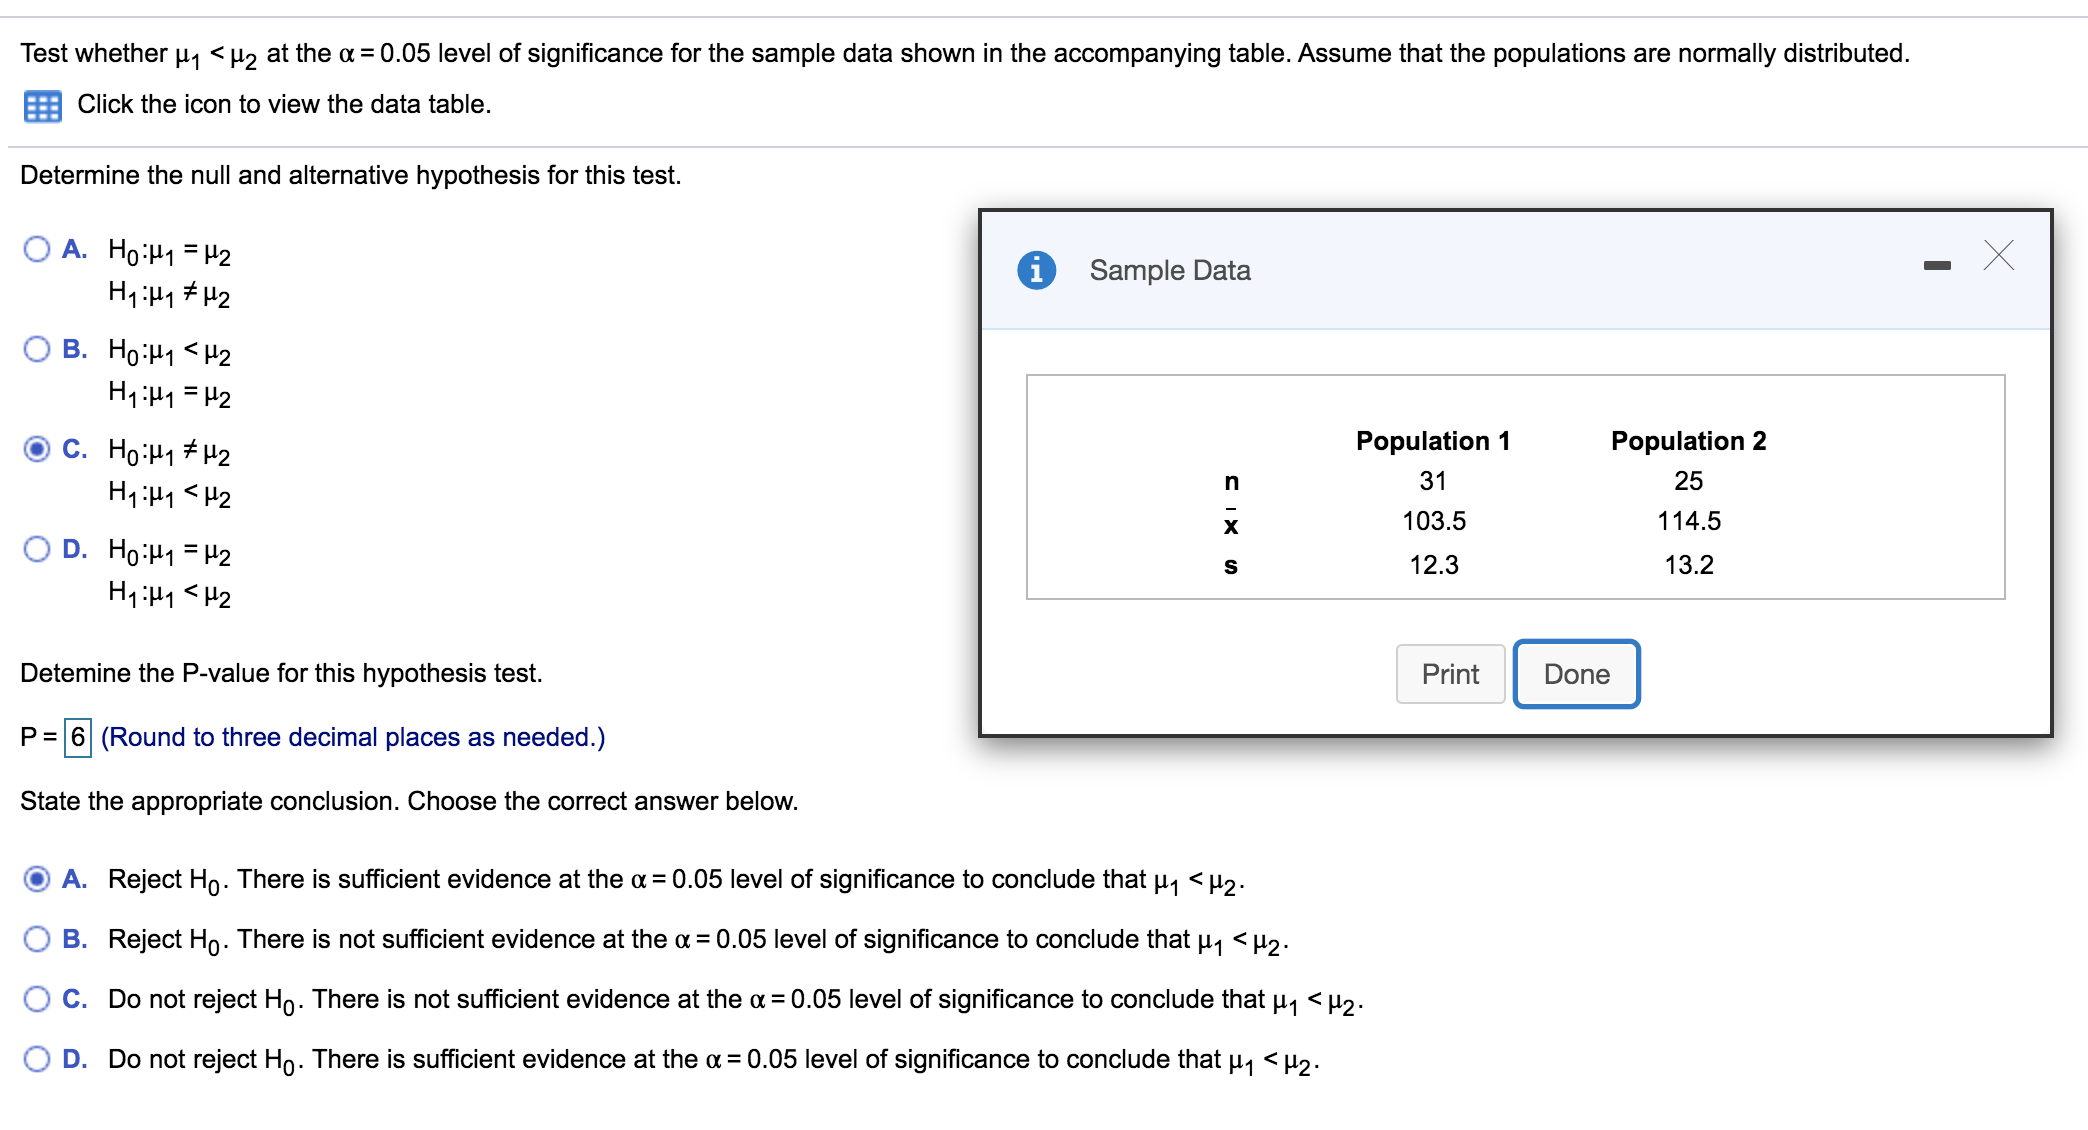
Transcribed Image Text:Test whether u, <µ2 at the a =0.05 level of significance for the sample data shown in the accompanying table. Assume that the populations are normally distributed.
Click the icon to view the data table.
Determine the null and alternative hypothesis for this test.
O A. Ho:H1 = H2
Sample Data
O B. Ho:H1 <H2
H1:H1 = H2
Population 1
Population 2
C. Ho:H1 # H2
H1:H1 <H2
31
25
103.5
114.5
O D. Ho:H1 = H2
12.3
13.2
Detemine the P-value for this hypothesis test.
Print
Done
P = 6 (Round to three decimal places as needed.)
State the appropriate conclusion. Choose the correct answer below.
O A. Reject Ho. There is sufficient evidence at the a = 0.05 level of significance to conclude that p, <µ2.
O B. Reject Ho. There is not sufficient evidence at the a = 0.05 level of significance to conclude that u1 <H2.
O C. Do not reject Ho. There is not sufficient evidence at the a = 0.05 level of significance to conclude that u, < µ2.
O D. Do not reject Ho. There is sufficient evidence at the a = 0.05 level of significance to conclude that u, <H2.
Expert Solution
This question has been solved!
Explore an expertly crafted, step-by-step solution for a thorough understanding of key concepts.

This is a popular solution!

Trending now
This is a popular solution!

Step by step
Solved in 5 steps with 10 images

Knowledge Booster


Learn more about
Need a deep-dive on the concept behind this application? Look no further. Learn more about this topic, statistics and related others by exploring similar questions and additional content below.Recommended textbooks for you
MATLAB: An Introduction with Applications
Statistics
ISBN:
9781119256830
Author:
Amos Gilat
Publisher:
John Wiley & Sons Inc

Probability and Statistics for Engineering and th…
Statistics
ISBN:
9781305251809
Author:
Jay L. Devore
Publisher:
Cengage Learning

Statistics for The Behavioral Sciences (MindTap C…
Statistics
ISBN:
9781305504912
Author:
Frederick J Gravetter, Larry B. Wallnau
Publisher:
Cengage Learning
MATLAB: An Introduction with Applications
Statistics
ISBN:
9781119256830
Author:
Amos Gilat
Publisher:
John Wiley & Sons Inc
Probability and Statistics for Engineering and th…
Statistics
ISBN:
9781305251809
Author:
Jay L. Devore
Publisher:
Cengage Learning
Statistics for The Behavioral Sciences (MindTap C…
Statistics
ISBN:
9781305504912
Author:
Frederick J Gravetter, Larry B. Wallnau
Publisher:
Cengage Learning

Elementary Statistics: Picturing the World (7th E…
Statistics
ISBN:
9780134683416
Author:
Ron Larson, Betsy Farber
Publisher:
PEARSON

The Basic Practice of Statistics
Statistics
ISBN:
9781319042578
Author:
David S. Moore, William I. Notz, Michael A. Fligner
Publisher:
W. H. Freeman

Introduction to the Practice of Statistics
Statistics
ISBN:
9781319013387
Author:
David S. Moore, George P. McCabe, Bruce A. Craig
Publisher:
W. H. Freeman