than the quantity of bonds interest rates until the money market reaches its After the decrease in the price level, the quantity of money demanded at the initial interest rate of 9% will be money supplied by the Fed at this interest rate. People will try to and other interest-bearing assets, and bond issuers will find that they new equilibrium at an interest rate of % The following graph shows the economy's aggregate demand curve. their money holdings. In order to do so, people will
than the quantity of bonds interest rates until the money market reaches its After the decrease in the price level, the quantity of money demanded at the initial interest rate of 9% will be money supplied by the Fed at this interest rate. People will try to and other interest-bearing assets, and bond issuers will find that they new equilibrium at an interest rate of % The following graph shows the economy's aggregate demand curve. their money holdings. In order to do so, people will

Chapter16: Monetary Policy
Section: Chapter Questions
Problem 2SQP

Related questions
Question
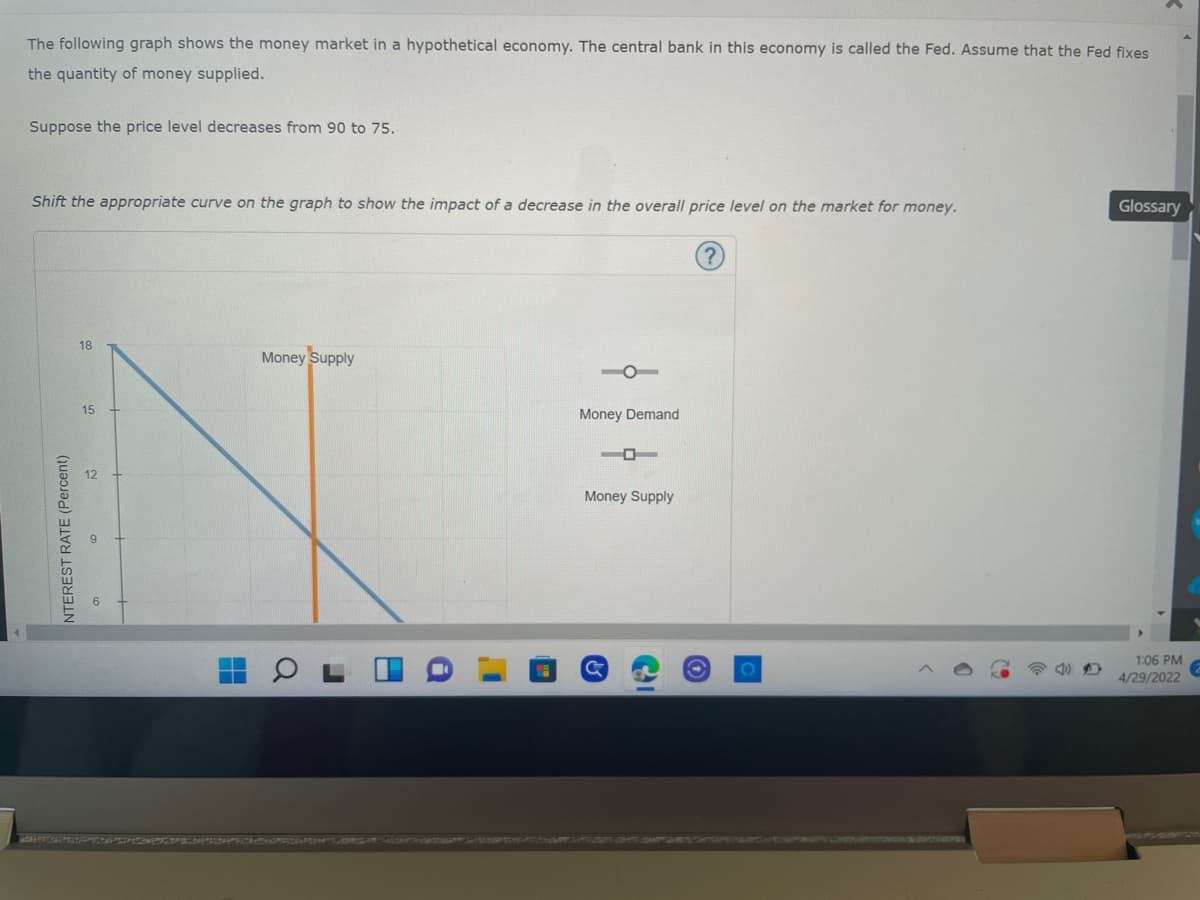
Transcribed Image Text:The following graph shows the money market in a hypothetical economy. The central bank in this economy is called the Fed. Assume that the Fed fixes
the quantity of money supplied.
Suppose the price level decreases from 90 to 75.
Shift the appropriate curve on the graph to show the impact of a decrease in the overall price level on the market for money.
Glossary
18
Money Supply
Money Demand
Money Supply
NTEREST RATE (Percent)
15
H
i
I
1:06 PM
4/29/2022
Transcribed Image Text:omework (Ch 21)
INTEREST RATE (Percent)
Money Supply
Money Demand
0
10
20
30
40
50
60
MONEY (Billions of dollars)
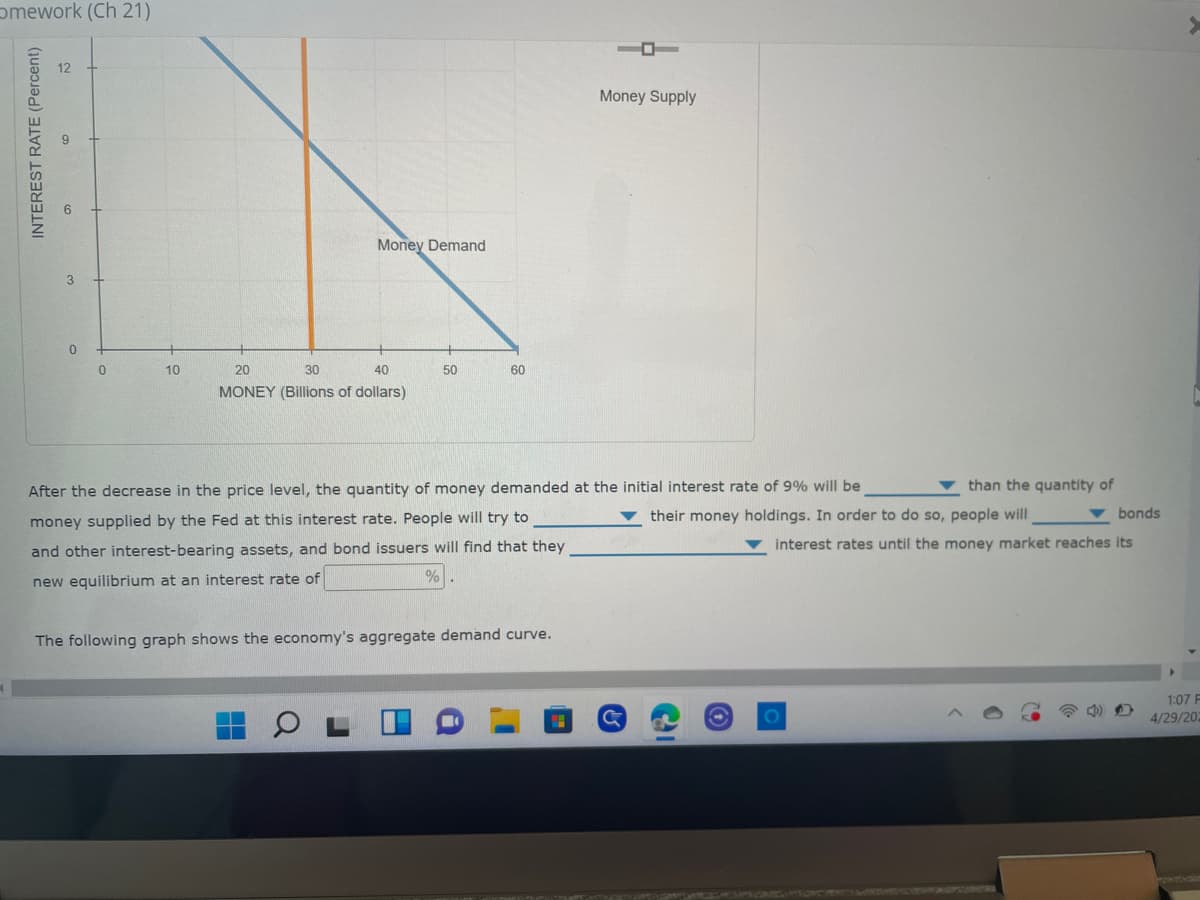
After the decrease in the price level, the quantity of money demanded at the initial interest rate of 9% will be
money supplied by the Fed at this interest rate. People will try to
and other interest-bearing assets, and bond issuers will find that they
new equilibrium at an interest rate of
%
The following graph shows the economy's aggregate demand curve.
3
0
J
than the quantity of
bonds
interest rates until the money market reaches its
their money holdings. In order to do so, people will
1:07 F
4/29/202
Expert Solution
This question has been solved!
Explore an expertly crafted, step-by-step solution for a thorough understanding of key concepts.

This is a popular solution!

Trending now
This is a popular solution!

Step by step
Solved in 2 steps with 1 images

Knowledge Booster


Learn more about
Need a deep-dive on the concept behind this application? Look no further. Learn more about this topic, economics and related others by exploring similar questions and additional content below.Recommended textbooks for you

