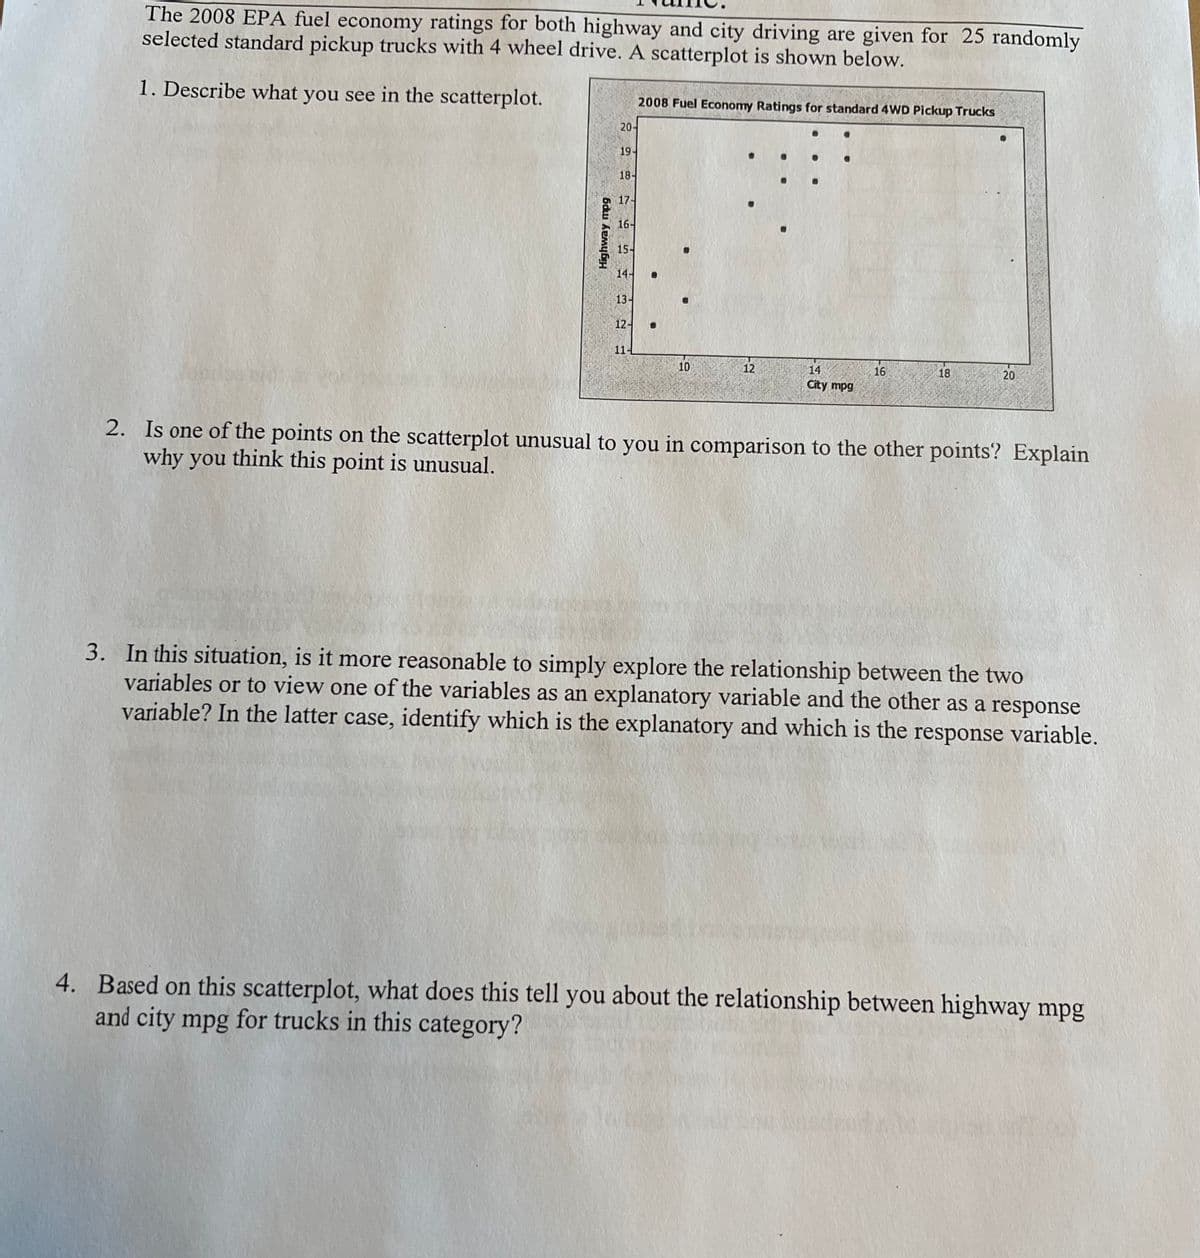
The 2008 EPA fuel economy ratings for both highway and city driving are given for 25 randomly selected standard pickup trucks with 4 wheel drive. A scatterplot is shown below. 1. Describe what you see in the scatterplot. 20 19- 18- g 17- 16- Highway mpg 15- 14- 13- 12- 11- 2008 Fuel Economy Ratings for standard 4WD Pickup Trucks 10 12 14 City mpg 16 18 2. Is one of the points on the scatterplot unusual to you in comparison to the other points? Explain why you think this point is unusual. 3. In this situation, is it more reasonable to simply explore the relationship between the two variables or to view one of the variables as an explanatory variable and the other as a response variable? In the latter case, identify which is the explanatory and which is the response variable. 4. Based on this scatterplot, what does this tell you about the relationship between highway mpg and city mpg for trucks in this category?
The 2008 EPA fuel economy ratings for both highway and city driving are given for 25 randomly selected standard pickup trucks with 4 wheel drive. A scatterplot is shown below. 1. Describe what you see in the scatterplot. 20 19- 18- g 17- 16- Highway mpg 15- 14- 13- 12- 11- 2008 Fuel Economy Ratings for standard 4WD Pickup Trucks 10 12 14 City mpg 16 18 2. Is one of the points on the scatterplot unusual to you in comparison to the other points? Explain why you think this point is unusual. 3. In this situation, is it more reasonable to simply explore the relationship between the two variables or to view one of the variables as an explanatory variable and the other as a response variable? In the latter case, identify which is the explanatory and which is the response variable. 4. Based on this scatterplot, what does this tell you about the relationship between highway mpg and city mpg for trucks in this category?

Glencoe Algebra 1, Student Edition, 9780079039897, 0079039898, 2018
18th Edition
ISBN:9780079039897
Author:Carter
Publisher:Carter
Chapter10: Statistics
Section: Chapter Questions
Problem 13PT

Related questions
Question
Transcribed Image Text:The 2008 EPA fuel economy ratings for both highway and city driving are given for 25 randomly
selected standard pickup trucks with 4 wheel drive. A scatterplot is shown below.
1. Describe what you see in the scatterplot.
Highway mpg
20-
19-
18-
2016.15 10
17-
14-
13-
12-
11-4
2008 Fuel Economy Ratings for standard 4WD Pickup Trucks
#
10
12
14
City mpg
16
18
20
2. Is one of the points on the scatterplot unusual to you in comparison to the other points? Explain
why you think this point is unusual.
3. In this situation, is it more reasonable to simply explore the relationship between the two
variables or to view one of the variables as an explanatory variable and the other as a response
variable? In the latter case, identify which is the explanatory and which is the response variable.
4. Based on this scatterplot, what does this tell you about the relationship between highway mpg
and city mpg for trucks in this category?
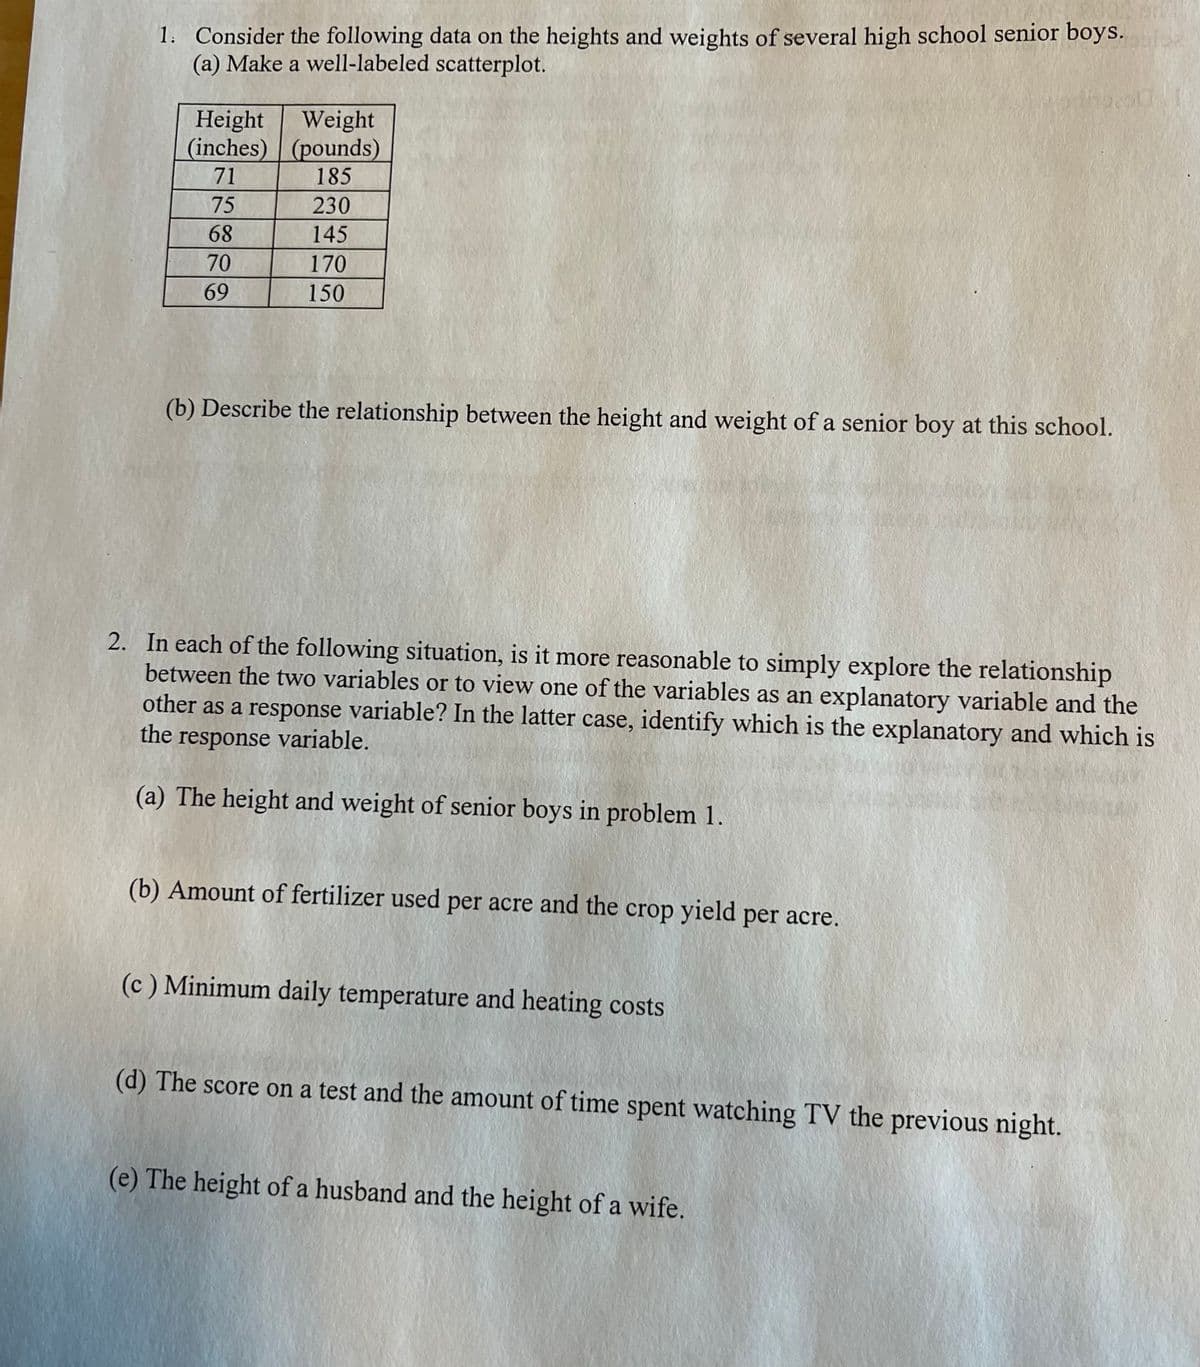
Transcribed Image Text:1. Consider the following data on the heights and weights of several high school senior boys.
(a) Make a well-labeled scatterplot.
Height
Weight
(inches) (pounds)
71
185
75
230
68
145
170
150
70
69
(b) Describe the relationship between the height and weight of a senior boy at this school.
2. In each of the following situation, is it more reasonable to simply explore the relationship
between the two variables or to view one of the variables as an explanatory variable and the
other as a response variable? In the latter case, identify which is the explanatory and which is
the response variable.
(a) The height and weight of senior boys in problem 1.
(b) Amount of fertilizer used per acre and the crop yield per acre.
(c) Minimum daily temperature and heating costs
(d) The score on a test and the amount of time spent watching TV the previous night.
(e) The height of a husband and the height of a wife.
Expert Solution
This question has been solved!
Explore an expertly crafted, step-by-step solution for a thorough understanding of key concepts.

This is a popular solution!

Trending now
This is a popular solution!

Step by step
Solved in 2 steps with 1 images

Recommended textbooks for you
Glencoe Algebra 1, Student Edition, 9780079039897…
Algebra
ISBN:
9780079039897
Author:
Carter
Publisher:
McGraw Hill

Big Ideas Math A Bridge To Success Algebra 1: Stu…
Algebra
ISBN:
9781680331141
Author:
HOUGHTON MIFFLIN HARCOURT
Publisher:
Houghton Mifflin Harcourt

Holt Mcdougal Larson Pre-algebra: Student Edition…
Algebra
ISBN:
9780547587776
Author:
HOLT MCDOUGAL
Publisher:
HOLT MCDOUGAL
Glencoe Algebra 1, Student Edition, 9780079039897…
Algebra
ISBN:
9780079039897
Author:
Carter
Publisher:
McGraw Hill
Big Ideas Math A Bridge To Success Algebra 1: Stu…
Algebra
ISBN:
9781680331141
Author:
HOUGHTON MIFFLIN HARCOURT
Publisher:
Houghton Mifflin Harcourt
Holt Mcdougal Larson Pre-algebra: Student Edition…
Algebra
ISBN:
9780547587776
Author:
HOLT MCDOUGAL
Publisher:
HOLT MCDOUGAL

College Algebra (MindTap Course List)
Algebra
ISBN:
9781305652231
Author:
R. David Gustafson, Jeff Hughes
Publisher:
Cengage Learning