The above figure is for a firm in monopolistic competition. The diagram represents the short run rather than the long run because MC АТС 1 MR D 20 40 60 80 100 120 Quantity (units per day) A. the MR curve cuts the ATC curve from below. O B. the MR curve and the D curve do not coincide. OC. the firm is incurring an economic loss. OD. the firm is earning an economic profit. ..........O........ ......... 3. 2. Price and costs (dollars per unit)
The above figure is for a firm in monopolistic competition. The diagram represents the short run rather than the long run because MC АТС 1 MR D 20 40 60 80 100 120 Quantity (units per day) A. the MR curve cuts the ATC curve from below. O B. the MR curve and the D curve do not coincide. OC. the firm is incurring an economic loss. OD. the firm is earning an economic profit. ..........O........ ......... 3. 2. Price and costs (dollars per unit)

Chapter14: Monopolistic Competition And Product Differentiation
Section: Chapter Questions
Problem 10P

Related questions
Question
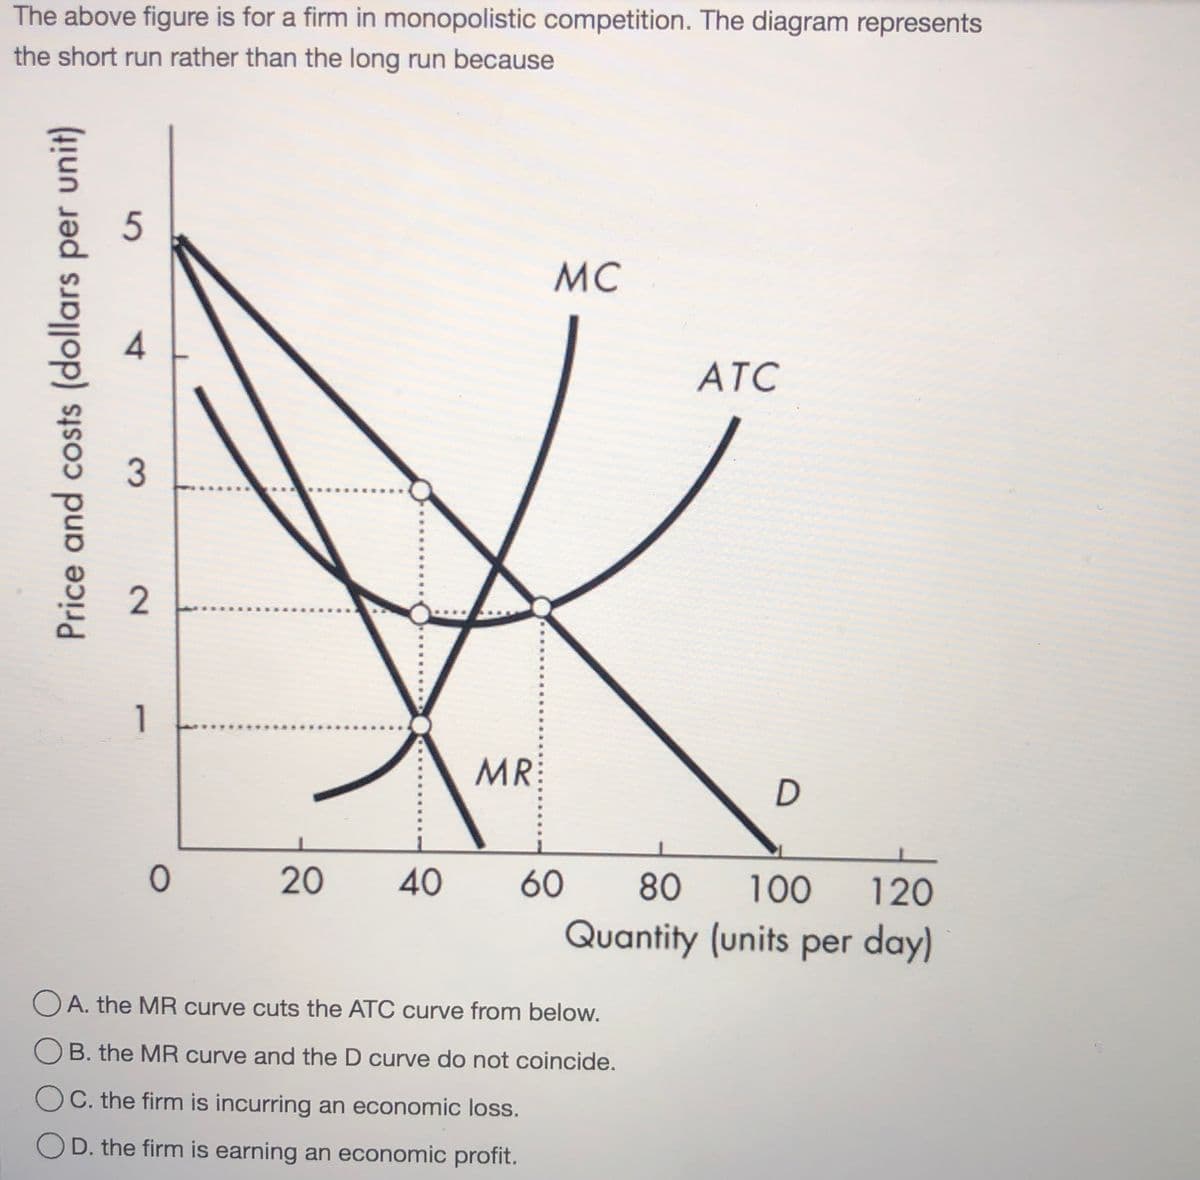
Transcribed Image Text:The above figure is for a firm in monopolistic competition. The diagram represents
the short run rather than the long run because
5
MC
4
АТС
1
MR
20
40
60
80
100
120
Quantity (units per day)
A. the MR curve cuts the ATC curve from below.
O B. the MR curve and the D curve do not coincide.
OC. the firm is incurring an economic loss.
OD. the firm is earning an economic profit.
3.
2.
Price and costs (dollars per unit)
Expert Solution
This question has been solved!
Explore an expertly crafted, step-by-step solution for a thorough understanding of key concepts.

This is a popular solution!

Trending now
This is a popular solution!

Step by step
Solved in 2 steps

Knowledge Booster


Learn more about
Need a deep-dive on the concept behind this application? Look no further. Learn more about this topic, economics and related others by exploring similar questions and additional content below.Recommended textbooks for you
Exploring Economics
Economics
ISBN:
9781544336329
Author:
Robert L. Sexton
Publisher:
SAGE Publications, Inc


Exploring Economics
Economics
ISBN:
9781544336329
Author:
Robert L. Sexton
Publisher:
SAGE Publications, Inc


Economics: Private and Public Choice (MindTap Cou…
Economics
ISBN:
9781305506725
Author:
James D. Gwartney, Richard L. Stroup, Russell S. Sobel, David A. Macpherson
Publisher:
Cengage Learning