The accompanying data are the weights (kg) of poplar trees that were obtained from trees planted in a rich and moist region. The trees were given different treatments identified in the accompanying table. Also shown are partial results from using the Bonferroni test with the sample data. Complete parts (a) through (c). E Click the icon to view the data table of the poplar weights and the Bonferroni results. a. Use a 0.10 significance level to test the claim that the different treatments result in the same mean weight. Determine the null and alternative hypotheses. Ho: Determine the test statistic. The test statistic is (Round to two decimal places as needed.) Determine the P-value. The P-value is (Round to three decimal places as needed.) What is the conclusion for this hypothesis test at a 0.10 significance level? O A. Reject H,. There is sufficient evidence to warrant rejection of the claim that the four different treatments yield the same mean poplar weight. O B. Fail to reject Ho. There is sufficient evidence to warrant rejection of the claim that the four different treatments yield the same mean poplar weight.
The accompanying data are the weights (kg) of poplar trees that were obtained from trees planted in a rich and moist region. The trees were given different treatments identified in the accompanying table. Also shown are partial results from using the Bonferroni test with the sample data. Complete parts (a) through (c). E Click the icon to view the data table of the poplar weights and the Bonferroni results. a. Use a 0.10 significance level to test the claim that the different treatments result in the same mean weight. Determine the null and alternative hypotheses. Ho: Determine the test statistic. The test statistic is (Round to two decimal places as needed.) Determine the P-value. The P-value is (Round to three decimal places as needed.) What is the conclusion for this hypothesis test at a 0.10 significance level? O A. Reject H,. There is sufficient evidence to warrant rejection of the claim that the four different treatments yield the same mean poplar weight. O B. Fail to reject Ho. There is sufficient evidence to warrant rejection of the claim that the four different treatments yield the same mean poplar weight.

College Algebra (MindTap Course List)
12th Edition
ISBN:9781305652231
Author:R. David Gustafson, Jeff Hughes
Publisher:R. David Gustafson, Jeff Hughes
Chapter8: Sequences, Series, And Probability
Section8.7: Probability
Problem 5E: List the sample space of each experiment. Rolling one die and tossing one coin

Related questions
Question
p value, t test and conclusion
Transcribed Image Text:The accompanying data are the weights (kg) of poplar trees that were obtained from trees planted in a rich and moist region. The trees were given different
treatments identified in the accompanying table. Also shown are partial results from using the Bonferroni test with the sample data. Complete parts (a) through (c).
Click the icon to view the data table of the poplar weights and the Bonferroni results.
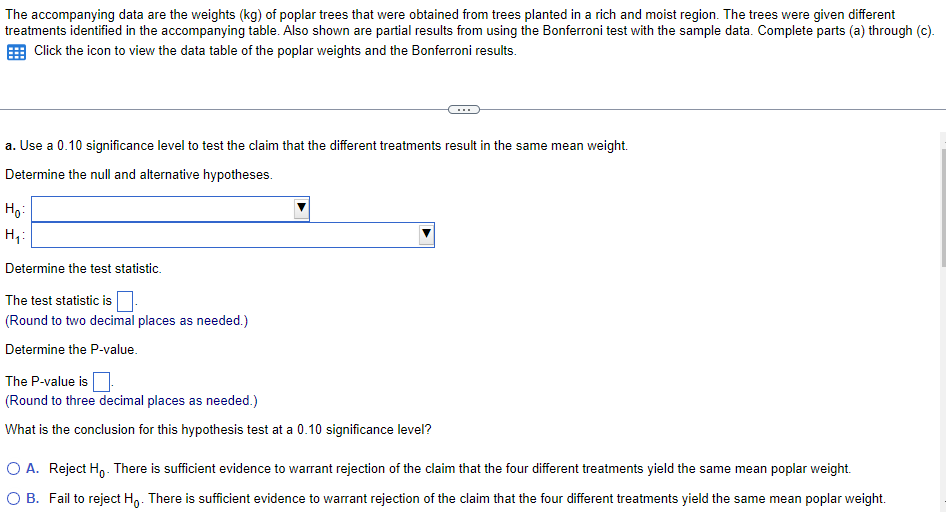
a. Use a 0.10 significance level to test the claim that the different treatments result in the same mean weight.
Determine the null and alternative hypotheses.
H9:
Determine the test statistic.
The test statistic isO
(Round to two decimal places as needed.)
Determine the P-value.
The P-value is O
(Round to three decimal places as needed.)
What is the conclusion for this hypothesis test at a 0.10 significance level?
O A. Reject H,- There is sufficient evidence to warrant rejection of the claim that the four different treatments yield the same mean poplar weight.
O B. Fail to reject H,. There is sufficient evidence to warrant rejection of the claim that the four different treatments yield the same mean poplar weight.
Transcribed Image Text:Use
- X
eter
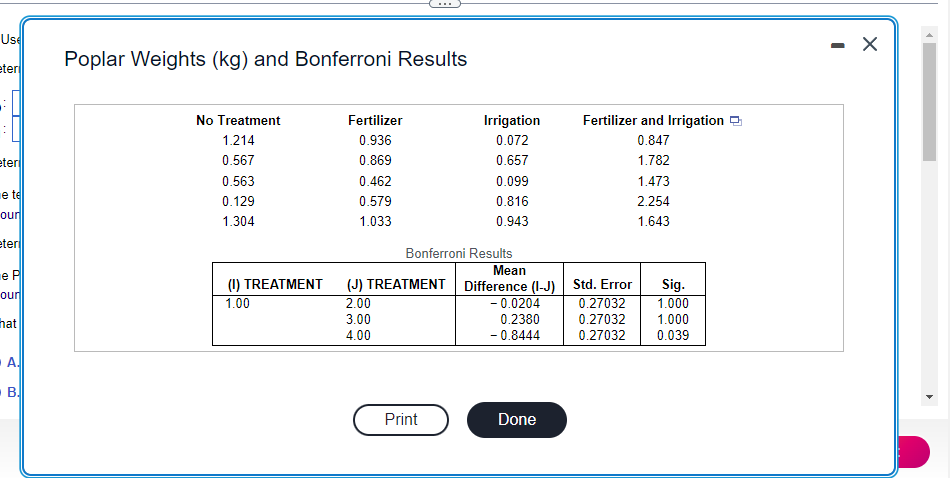
Poplar Weights (kg) and Bonferroni Results
No Treatment
Fertilizer
Irrigation
Fertilizer and Irrigation a
1.214
0.936
0.072
0.847
eter
0.567
0.869
0.657
1.782
0.563
0.462
0.099
1.473
e te
0.129
0.579
0.816
2.254
our
1.304
1.033
0.943
1.643
eteri
Bonferroni Results
e P
our
(1) TREATMENT
1.00
Mean
(J) TREATMENT Difference (I-J) Std. Error
- 0.0204
Sig.
1.000
2.00
0.27032
hat
3.00
0.2380
0.27032
1.000
4.00
- 0.8444
0.27032
0.039
A.
B.
Print
Done
Expert Solution
This question has been solved!
Explore an expertly crafted, step-by-step solution for a thorough understanding of key concepts.

This is a popular solution!

Trending now
This is a popular solution!

Step by step
Solved in 2 steps with 3 images

Recommended textbooks for you
College Algebra (MindTap Course List)
Algebra
ISBN:
9781305652231
Author:
R. David Gustafson, Jeff Hughes
Publisher:
Cengage Learning

Glencoe Algebra 1, Student Edition, 9780079039897…
Algebra
ISBN:
9780079039897
Author:
Carter
Publisher:
McGraw Hill
College Algebra (MindTap Course List)
Algebra
ISBN:
9781305652231
Author:
R. David Gustafson, Jeff Hughes
Publisher:
Cengage Learning
Glencoe Algebra 1, Student Edition, 9780079039897…
Algebra
ISBN:
9780079039897
Author:
Carter
Publisher:
McGraw Hill