The accompanying data on x = current density (mA/cm) and y = rate of deposition (um/min) appeared in a recent study. 20 24 40 60 1.20 1.71 80 2.22 A) Do you agree with the claim by the article's author that "a linear relationship was obtained from the tin-lead rate of deposition as a function of current density"? Note: Scatter plot is not required. B) Determine the linear regression equation.
The accompanying data on x = current density (mA/cm) and y = rate of deposition (um/min) appeared in a recent study. 20 24 40 60 1.20 1.71 80 2.22 A) Do you agree with the claim by the article's author that "a linear relationship was obtained from the tin-lead rate of deposition as a function of current density"? Note: Scatter plot is not required. B) Determine the linear regression equation.

Algebra & Trigonometry with Analytic Geometry
13th Edition
ISBN:9781133382119
Author:Swokowski
Publisher:Swokowski
Chapter7: Analytic Trigonometry
Section7.6: The Inverse Trigonometric Functions
Problem 91E

Related questions
Question
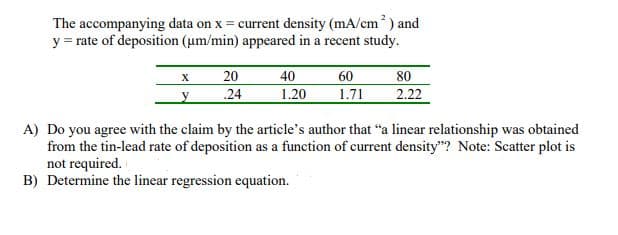
Transcribed Image Text:The accompanying data on x = current density (mA/cm) and
y = rate of deposition (um/min) appeared in a recent study.
40
1.20
80
2.22
20
60
1.71
.24
A) Do you agree with the claim by the article's author that "a linear relationship was obtained
from the tin-lead rate of deposition as a function of current density"? Note: Scatter plot is
not required.
B) Determine the linear regression equation.
Expert Solution
This question has been solved!
Explore an expertly crafted, step-by-step solution for a thorough understanding of key concepts.

This is a popular solution!

Trending now
This is a popular solution!

Step by step
Solved in 3 steps with 5 images

Recommended textbooks for you
Algebra & Trigonometry with Analytic Geometry
Algebra
ISBN:
9781133382119
Author:
Swokowski
Publisher:
Cengage

Functions and Change: A Modeling Approach to Coll…
Algebra
ISBN:
9781337111348
Author:
Bruce Crauder, Benny Evans, Alan Noell
Publisher:
Cengage Learning
Algebra & Trigonometry with Analytic Geometry
Algebra
ISBN:
9781133382119
Author:
Swokowski
Publisher:
Cengage
Functions and Change: A Modeling Approach to Coll…
Algebra
ISBN:
9781337111348
Author:
Bruce Crauder, Benny Evans, Alan Noell
Publisher:
Cengage Learning