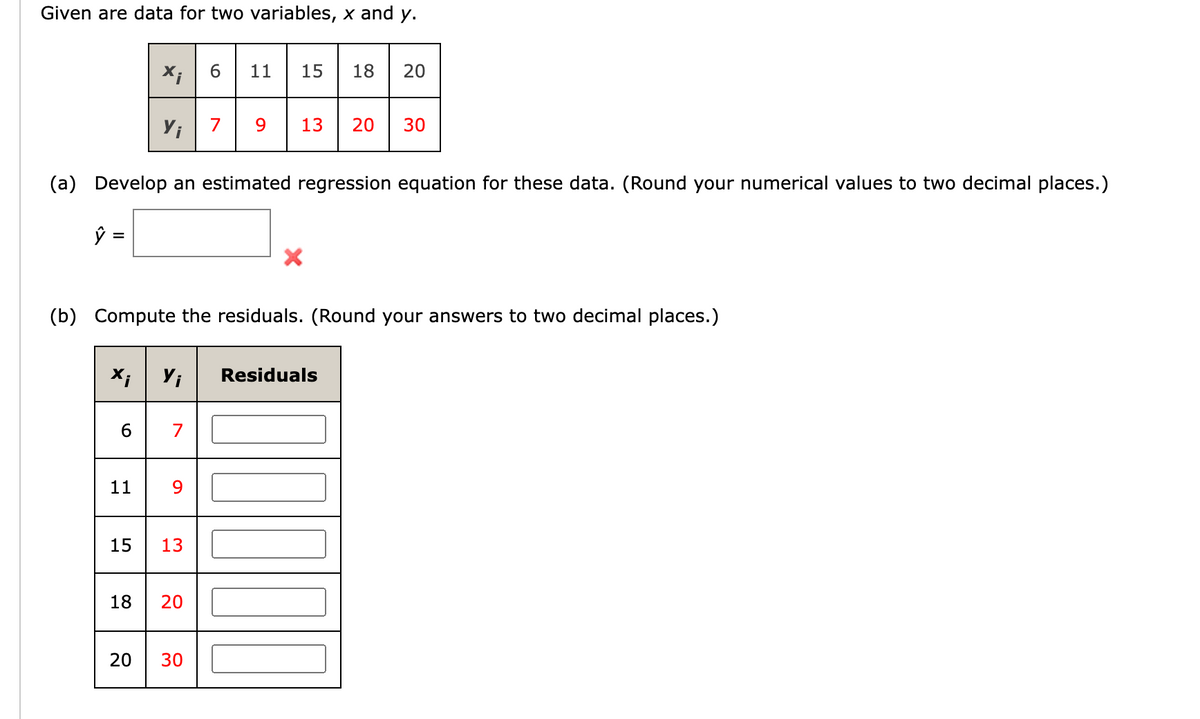
Given are data for two variables, x and y. 11 15 18 20 7 13 20 30 (a) Develop an estimated regression equation for these data. (Round your numerical values to two decimal places.) (b) Compute the residuals. (Round your answers to two decimal places.) Residuals 11 9. 15 13 18 30 20 20


Q: Consider the following data for two variables, x and y. 32 18 15 9 26 y 10 20 22 17 22 (a) Develop…
A: The following data for two variables x and y are given: a) Regression statistics,…
Q: Consider the following output for a linear regression: The regression equation is In(y) = 7.55 -…
A:
Q: The table below shows the number of state-registered automatic weapons and the murder rate for…
A:
Q: Consider the following data for two variables, x and y. x 9 32 18 15 26 y 9 20 21 | 17 23 (a)…
A: a) Excel Procedure: Enter X and Y data in Excel Go to Data Click on Data Analysis> ‘Regression’.…
Q: Given the data in the table below for the dependent variable Y and independent variables X1, X2, and…
A: Since you have posted a question with multiple sub-parts, we will solve first three subparts for…
Q: The table below shows the nurmber of state-registered automatic weapons and the murder rate for…
A:
Q: B8. A shop owner would like to analyse the relationship between the temperature on any given day (in…
A: The linear regression model is y = a + bx Here, a = intercept & b = slope, y =…
Q: The following table shows the annual number of PhD graduates in a country in various fields.…
A:
Q: The table below shows the number of state-registered automatic weapons and the murder rate for…
A: Carefully examine the given table and the given equation to help the solve the given problem
Q: The table below shows the number of state-registered automatic weapons and the murder rate for…
A: The line of regression is: y=0.83x+4.09 where, x = thousands of automatic weapons y = murders per…
Q: 6 11 15 18 20 Y 5 13 20 30 (a) Develop an estimated regression equation for these data. (Round your…
A: For the given data set Find Residuals Do the assumptions about the error terms seem to be satisfied?
Q: The table below shows the number of state-registered automatic weapons and the murder rate for…
A: The independent variable is thousands of automatic weapons. The dependent variable is murders per…
Q: 1. The relationship between energy consumption and household income was studied, yielding the…
A: The independent variable is Household income. The dependent variable is Energy consumption. We have…
Q: The table below shows the average temperature in New York City (NYC), measured in degrees Fahrenheit…
A:
Q: Fit a nonlinear regression equation of the form y = aX® to the following data: 5 1 2 3 4 2.98 4.26…
A: The power regression technique uses a dataset to determine a function, y=axb such that the data set…
Q: 5) Since 1990, fireworks usage nationwide has grown, as shown in the accompanying table, where…
A:
Q: The following table shows the annual number of PhD graduates in a country in various fields.…
A: Excel output:
Q: Consider the following data for two variables, x and y. 32 18 15 26 y 11 | 19 20| 17 | 21 (a)…
A: Given: x y 9 9 32 19 18 22 15 17 26 23
Q: The data shows that the percentage of female cigarette smokers in a certain country declined from…
A: The regression equation is f = -0.40t + 22.24, where f is the percentage of female smokers and t is…
Q: The table below shows the number of state-registered automatic weapons and the murder rate for…
A: given x=thousand of automatic weapon y=murder per 100000 residents we need to find a)how many…
Q: Consider the following data for two variables, x and y. x 22 24 26 30 35 40 y 13 20 34 35 40 36 (a)…
A: "Since you have posted a question with multiple sub-parts, we'll solve the first three sub-parts for…
Q: The table below shows the average temperature in New York City (NYC), measured in degrees Fahrenheit…
A: Concept: We have given the temperature with respect to the months That is for each month the degree…
Q: the table below shows the number of state-registered automatic weapons and the murder rate for…
A:
Q: A researcher is interested in learning how strong is the association be- tween the sodium intake and…
A:
Q: 2) The accompanying table shows the percent of the adult population that married before age 25 in…
A: Given: From the above table X is years and Y is percent. Sum of X…
Q: The managing director of a company wants to find whether there is a relationship between units of a…
A: Ans . ( i ) X Y X-Mx Y-My (X - Mx)2 (Y - My)2 (X - Mx)(Y - My) 23581110121517182024…
Q: Develop an estimated regression equation for the data of the form ŷ = b0 + b1x + b2x2. (Round b0…
A: The scatterplot is obtained by using EXCEL. The software procedure is given below: In first column…
Q: Consider the following model of stock prices: Price=Bo + Biearning + ɛ. Where earning is the annual…
A: d. Using Excel, calculate SSE: SSE=∑ (Y-(β0+β1*X))2 95% Confidence interval for slope parameter:…
Q: The figures for Triple A's revenue and the amount of money earned by wage earners in Albany - NY has…
A: The required table for the given data can be formed as follows Y X (X-X_bar)^2 (Y-Y)(X-X) 6.5…
Q: The table below shows the number of state-registered automatic weapons and the murder rate for…
A: In this case thousands of automatic weapons (x) is the independent variable and murders per 100,000…
Q: In an study similar to the one in Exercise 3, the relative humidity and ozone levels were measured…
A: a. From the output, Slope =-0.13468 ≈ -0.135 b. The sample size is 120. The degrees of…
Q: One of the residuals in a linear regression model is equal to 6.5. Other results from the model…
A: Solution: It is given here: Residual = 6.5 SSE = 182 MSE = 3.2
Q: The table below shows the number of state-registered automatic weapons and the murder rate for…
A: Given , x = thousands of automatic weapons y = Murders per 100,000 Given regression equation , y…
Q: 2 4 10 y 10 13 57 33 27 1) Find Σ E (zy) 2) Find the Correlation Coefficient r round off up to 3…
A: The given data is, X Y 2 10 4 13 10 57 6 33 5 27
Q: Consider the following table containing unemployment rates for a 10-year period. Unemployment…
A: The unemployment rates for 10 years are given. The model of regression: Estimated Unemployment Rate…
Q: A statistical program is recommended. Consider the following data for two variables, x and y. X 9…
A: a) The data inserted in EXCEL is defined below:
Q: 1) Given are five observations collected in a regression study on two variables. 2 4 5 7 8 2 3 6 4…
A: Given data x 2 4 5 7 8 y 2 3 2 6 4
Q: 3. The following data were collected during an experiment in which laboratory animals were…
A: 3. It is been asked to find the simple linear regression using the given data.
Q: Consider the following data for two variables, x and y. x 22 24 26 30 35 40 y 11 21 34 36 39 36…
A: From the given information, x y x^2 22 11 484 24 21 576 26 34 676 30 36 900 35 39 1225…
Q: 002 49 Q1. [6 points] :From the following data set 1 4. 6. 11 16 1.find correlation coefficients 2.…
A: Given table : X Y 1 4 2 8 3 9 6 11 5 16
Q: Consider the following data for two variables, x and y x 9 32 18 15 26 y 9 20 22 17 23 A.…
A: We perform regression using the step by step procedure using excel as below: Enter the data into…
Q: Given are data for two variables, x and y. 6 11 15 18 20 7. 13 20 30 (a) Develop an estimated…
A: Since you have asked multiple subparts questions, we will solve first three subparts for you. To get…
Q: Brand A D C --0 P G H 1 3 10. 0140 H₂A₁D data on Weight H₂O ONA 20 H₂ P₁ <0 H₁₁0 16.1 14.9 15.9…
A: Solution: Given information: n= 10 observation k= 1 independent variable SSE= 6833947.38 Sum of…
Q: 2. The sales, in millions of pesos, of a certain company are shown in the table below. Year X Sales…
A: From the provided information, Year X Sales Y 1 12 2 15 3 17 4 18…
Q: The table below shows enrollment,† in millions of people, in private colleges in the United States…
A:
Q: The table below shows the number of state-registered automatic weapons and the murder rate for…
A: Given: X = thousands of automatic weaponsY = murders per 100,000 residents The equation of linear…
Q: 4) The data below are the number of absences and the final grades of 9 randomly selected students…
A: Given data: Number of absences 0 3 6 4 9 2 15 8 5 Final grade 98 86 80 82 71 92 55 76 82
Q: The table below shows the number of state-registered automatic weapons and the murder rate for…
A: Given, x y 11.9 14 8.4 11.1 6.8 9.6 3.8 7.3 2.9 6.7 2.7 6.5 2.6 6.3 0.5 4.7
Q: Given the information below calculated from data collected from a sample of 8 students relating…
A:
Q: The following data give the percentage of women working in five companies in the retail and trade…
A: Linear regression equation is a equation that is used to predict the relation between two variables…


Trending now
This is a popular solution!

Step by step
Solved in 2 steps with 1 images

- XYZ Corporation Stock Prices The following table shows the average stock price, in dollars, of XYZ Corporation in the given month. Month Stock price January 2011 43.71 February 2011 44.22 March 2011 44.44 April 2011 45.17 May 2011 45.97 a. Find the equation of the regression line. Round the regression coefficients to three decimal places. b. Plot the data points and the regression line. c. Explain in practical terms the meaning of the slope of the regression line. d. Based on the trend of the regression line, what do you predict the stock price to be in January 2012? January 2013?The following fictitious table shows kryptonite price, in dollar per gram, t years after 2006. t= Years since 2006 0 1 2 3 4 5 6 7 8 9 10 K= Price 56 51 50 55 58 52 45 43 44 48 51 Make a quartic model of these data. Round the regression parameters to two decimal places.Special Rounding Instructions For this exercise set, round all regression parameters to three decimal places, but round all other answers to two decimal places unless otherwise indicated. Postal RatesThe table below shows the cost s, in cents, of a domestic first-class postage stamp in the United States tyears after 1900. t=time,inyearssince1900 s=costofstamp 19 2 32 3 58 4 71 8 78 15 85 22 95 32 102 37 109 44 116 47 a.Use exponential regression to model s as an exponential function of t. b.What cost does your model give for a 1988 stamp? Report your answer to the nearest cent. The actual cost was 25cents. c.Plot the data and the exponential model.
- Olympic Pole Vault The graph in Figure 7 indicates that in recent years the winning Olympic men’s pole vault height has fallen below the value predicted by the regression line in Example 2. This might have occurred because when the pole vault was a new event there was much room for improvement in vaulters’ performances, whereas now even the best training can produce only incremental advances. Let’s see whether concentrating on more recent results gives a better predictor of future records. (a) Use the data in Table 2 (page 176) to complete the table of winning pole vault heights shown in the margin. (Note that we are using x=0 to correspond to the year 1972, where this restricted data set begins.) (b) Find the regression line for the data in part ‚(a). (c) Plot the data and the regression line on the same axes. Does the regression line seem to provide a good model for the data? (d) What does the regression line predict as the winning pole vault height for the 2012 Olympics? Compare this predicted value to the actual 2012 winning height of 5.97 m, as described on page 177. Has this new regression line provided a better prediction than the line in Example 2?Special Rounding Instructions For this exercise set, round all regression parameters to three decimal places, but round all other answers to two decimal places unless otherwise indicated. Gray Wolves in WisconsinGray wolves were among the first mammals protected under the Endangered Species Act in the 1970s. Wolves recolonized in Wisconsin beginning in 1980.Their population grew reliably after 1985 as follows: Year Wolves Year Wolves 1985 15 1993 40 1986 16 1994 57 1987 18 1995 83 1988 28 1996 99 1989 31 1997 145 1990 34 1998 178 1991 40 1999 197 1992 45 2000 266 a. Explain why an exponential model may be appropriate. b. Are these data exactly exponential? Explain. c. Find an exponential model for these data. d. Plot the data and the exponential model. e. Comment on your graph in part d. Which data points are below or above the number predicted by the exponential model?Special Rounding Instructions For this exercise set, round all regression parameters to three decimal places, but round all other answers to two decimal places unless otherwise indicated. Design Patents The following table shows the number P of design patents awarded by the U.S. Patents and Trademark Office from 1950 through 2010. t = years since 1950 P = patents 0 4718 10 2543 20 3214 30 3949 40 8024 50 17,413 60 22,799 a.Use exponential regression to model P as a function of t. b.Plot the data along with the regression equation. c.In what years were there more patents awarded than might be expected from the model?
- Weekly sales of a company’s product (y) and those of its main competitor (x) were recorded for one year. Use ?=0.10. a) Conduct a regression analysis of these data. b) Plot the residuals versus the time periods. Does there appear to be autocorrelation? c) Perform the Durbin-Watson test. Is there evidence of autocorrelation? Use ?=0.10 d) If autocorrelation was detected in Part c, propose an alternative regression model to remedy the problem. Use the computer to generate the statistics associated with this model. e) Redo Parts b and c. Compare the two models. PLEASE ONLY USE EXCEL AND SHOW ALL EXCEL COMMANDS! Company Competitor 1383 1153 2022 1067 2429 1296 901 1406 2219 1254 1896 1335 1910 1204 1539 1076 2048 1246 2881 1098 2395 1258 1349 955 2052 954 2675 1363 1588 1022 2704 1155 3148 1807 2822 1295 2217 1116 2260 1323 3040 1326 3137 1107 2977 1163 2599 1254 2412 1017 3187 938 2598 1270 2995 1042 3046 1318 3858 1497…The prelim grades (x) and midterm grades (y) of a sample of 10 MMW students is modeled by the regression line y = 12.0623 + 0.7771x. Estimate the prelim grade if the midterm grade is 83.The grades of a sample of 9 students on a prelim exam (x) and on the midterm exam (y) are shown below. Find the regression equation. y = 34.661 + 0.433x y = 0.777 + 12.0623x y = 12.0623 + 0.777x y = 34.661 - 0.433x
- #26The quarterly sales data (number of copies sold) for a college textbook over the past three years follow. Quarterly Year 1 Year 2 Year 3 1 1690 1800 1850 2 940 900 1100 3 2625 2900 2930 4 2500 2360 2615 d. Regression analysis yields the following forecast equation: 2491.67 - 711.67QTR1 - 1511.67QTR2 + 326.67QTR3 + 23.13t; what is the forecast for period 15? Round to the nearest hundred e. Regression analysis yields the following forecast equation: 2491.67 - 711.67QTR1 - 1511.67QTR2 + 326.67QTR3 + 23.13t; what is the forecast for period 16? Round to the nearest hundredA group of students measure the length and width of a random sample of beans. They are interested in investigating the relationship between the length and width. Their summary statistics are displayed in the table below. All units, if applicable, are millimeters. Mean width: 7.555 Stdev width: 0.914 Mean height: 12.686 Stdev height: 1.634 Correlation coefficient: 0.8203 d) If the students are interested in using the height of the beans to predict the width, calculate the slope of this new regression equation. e) Write the equation of the best-fit line that can be used to predict bean widths. Use x to represent height and y to represent width.Calculate the estimated ‘Annual % ROI’ when the ‘Cost’ (X) is $160,000. Test the hypothesis: o H0: β1 = 0 o Ha: β1 ≠ 0 Write a paragraph or more on any observations you make about the regression estimates, coefficient of determination, the plots, and the results of your hypothesis tests. School Type Cost 30 Year ROI Annual ROI Private $221,700.00 $2,412,000.00 8.70% Private $213,000.00 $2,064,000.00 8.30% Private $230,100.00 $1,949,000.00 7.90% Private $222,600.00 $1,947,000.00 8.00% Private $225,800.00 $1,938,000.00 8.00% Public $87,660.00 $1,937,000.00 11.20% Private $224,900.00 $1,915,000.00 7.90% Private $221,600.00 $1,878,000.00 7.90% Public $125,100.00 $1,854,000.00 9.80% Private $215,700.00 $1,794,000.00 7.90% Public $92,530.00 $1,761,000.00 10.60% Private $217,800.00 $1,752,000.00 7.70% Public $89,700.00 $1,727,000.00 10.70% Private $229,600.00 $1,716,000.00 7.50% Public $101,500.00 $1,703,000.00 10.20% Public $115,500.00…

