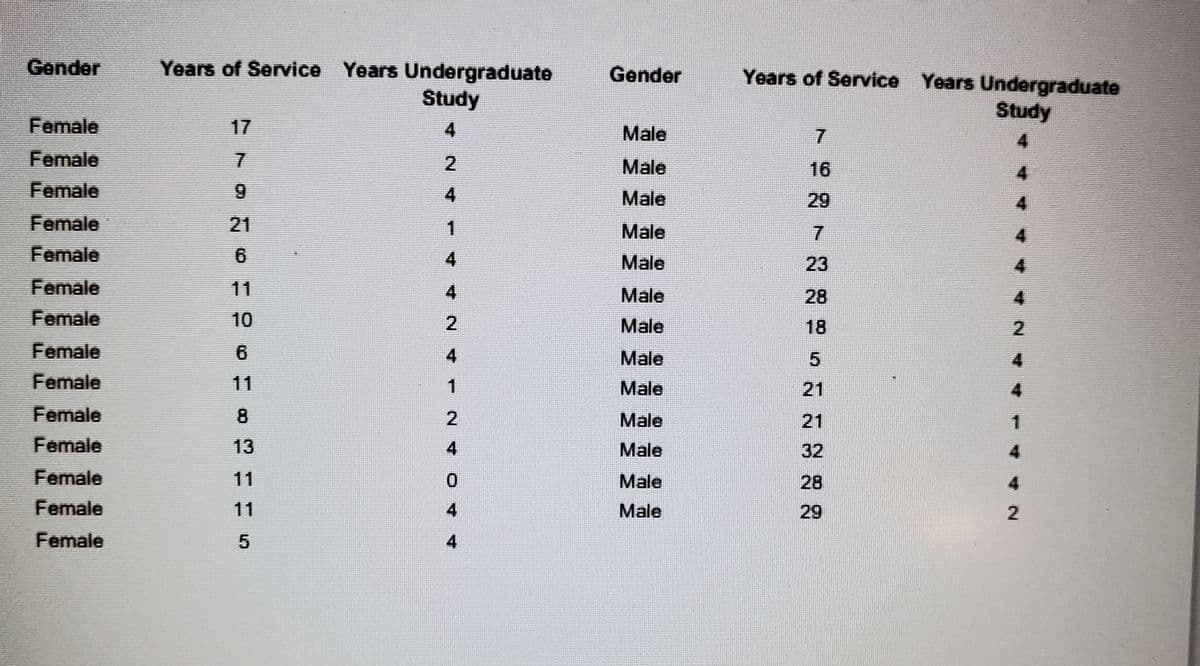
The accompanying data provides the results of a survey of 27 employees in a tax division of a Fortune 100 company. a. Test the null hypothesis that the average number of years of service is the same for males and females. Assume that the population variances are unequal. b. Test the null hypothesis that the average years of undergraduate study is the same for males and females. Assume that the population variances are unequal. Click the icon to view the survey data. a. Is there sufficient evidence at the 0.01 level of significance that the average number of years of service is the same for males and females? Determine the null hypothesis, Ho, and the alternative hypothesis, H, Let females be population 1 and males be population 2. Ho (Type integers or decimals. Do not round.)


Angles in Circles
Angles within a circle are feasible to create with the help of different properties of the circle such as radii, tangents, and chords. The radius is the distance from the center of the circle to the circumference of the circle. A tangent is a line made perpendicular to the radius through its endpoint placed on the circle as well as the line drawn at right angles to a tangent across the point of contact when the circle passes through the center of the circle. The chord is a line segment with its endpoints on the circle. A secant line or secant is the infinite extension of the chord.
Arcs in Circles
A circular arc is the arc of a circle formed by two distinct points. It is a section or segment of the circumference of a circle. A straight line passing through the center connecting the two distinct ends of the arc is termed a semi-circular arc.
7) see pictures to solve


Trending now
This is a popular solution!

Step by step
Solved in 2 steps with 4 images


