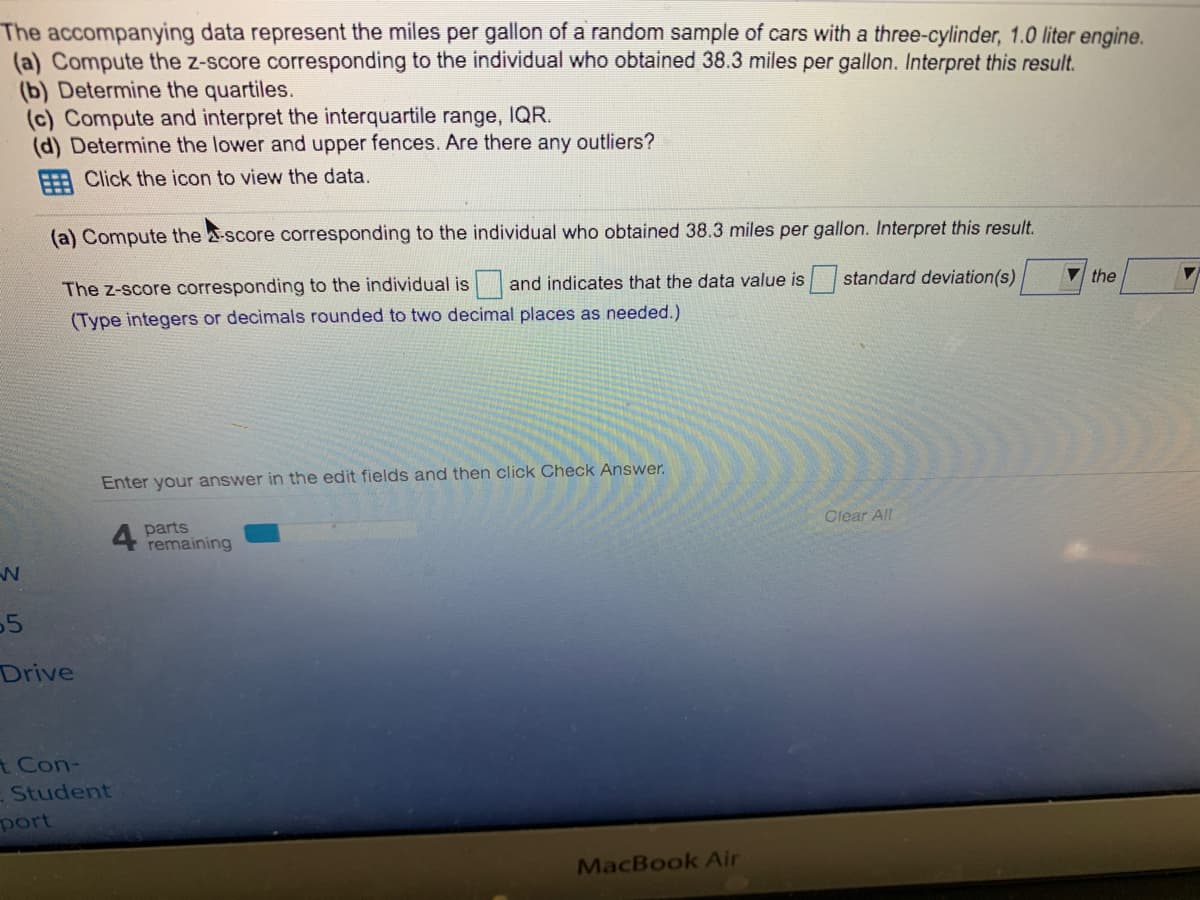
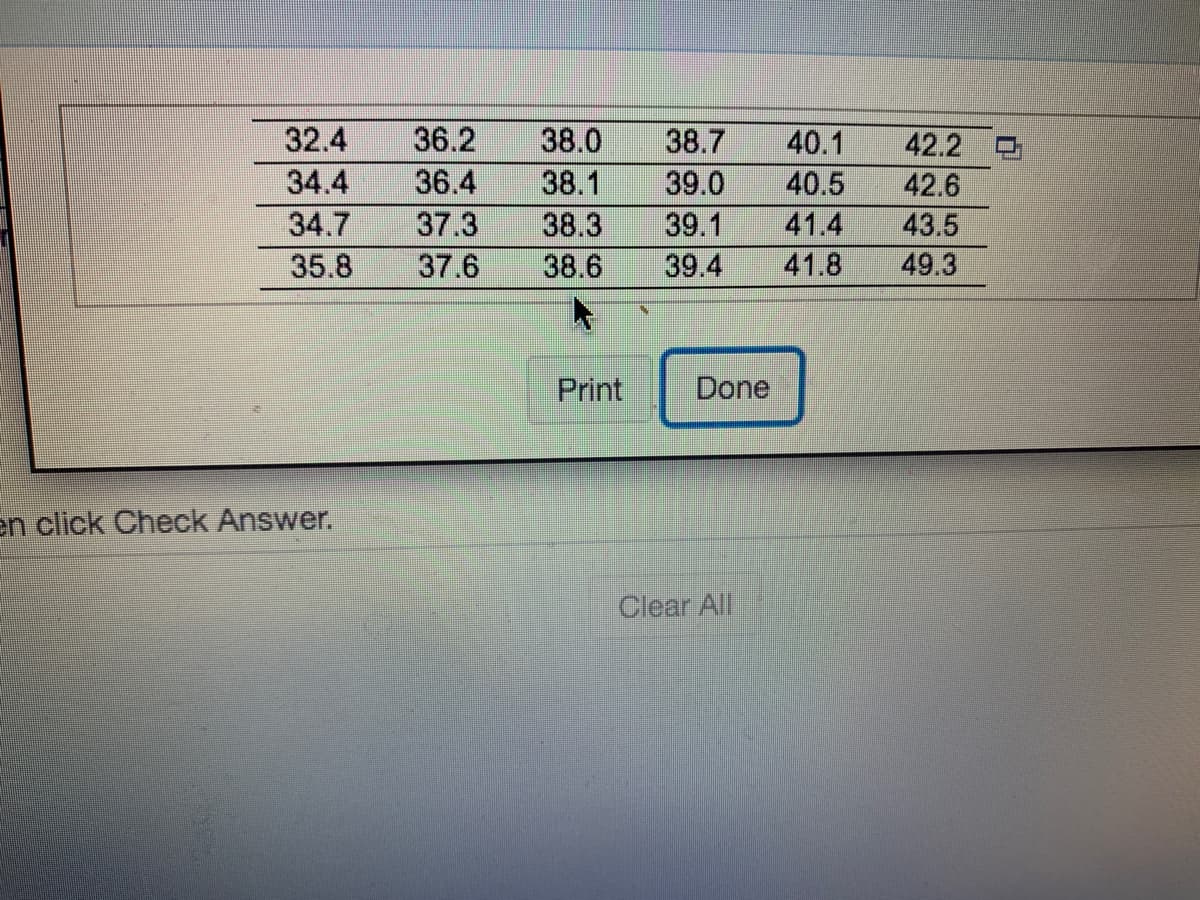
The accompanying data represent the miles per gallon of a random sample of cars with a three-cylinder, 1.0 liter engine (a) Compute the z-score corresponding to the individual who obtained 38.3 miles per gallon. Interpret this result. (b) Determine the quartiles. d intornrot tho intorauartilo range JOR


Inverse Normal Distribution
The method used for finding the corresponding z-critical value in a normal distribution using the known probability is said to be an inverse normal distribution. The inverse normal distribution is a continuous probability distribution with a family of two parameters.
Mean, Median, Mode
It is a descriptive summary of a data set. It can be defined by using some of the measures. The central tendencies do not provide information regarding individual data from the dataset. However, they give a summary of the data set. The central tendency or measure of central tendency is a central or typical value for a probability distribution.
Z-Scores
A z-score is a unit of measurement used in statistics to describe the position of a raw score in terms of its distance from the mean, measured with reference to standard deviation from the mean. Z-scores are useful in statistics because they allow comparison between two scores that belong to different normal distributions.


Trending now
This is a popular solution!

Learn your way
Includes step-by-step video

Step by step
Solved in 2 steps


