The accompanying data represent the number of days absent, x, and the final exam score, y, for a sample of college students in a general education course at a large state university. Complete parts (a) through (e) below. E Click the icon to view the absence count and final exam score data. 9 Click the icon to view a table of critical values for the correlation coefficient (a) Find the least-squares regression line treating number of absences as the explanatory variable and the final exam score as the response variable. y = -2.771 x+ 88.290 (Round to three decimal places as needed.) (b) Interpret the slope and the y-intercept, if appropriate. Choose the correct answer below and fill in any answer boxes in your choice. (Round to three decimal places as needed.) O A. The average final exam score of students who miss no classes is It is not appropriate to interpret the slope. O B. For every additional absence, a student's final exam score drops points, on average. The average final exam score of students who miss no classes is O C. For every additional absence, a student's final exam score drops points, on average. It is not appropriate to interpret the y-intercept. O D. It is not appropriate to interpret the slope or the y-intercept.
The accompanying data represent the number of days absent, x, and the final exam score, y, for a sample of college students in a general education course at a large state university. Complete parts (a) through (e) below. E Click the icon to view the absence count and final exam score data. 9 Click the icon to view a table of critical values for the correlation coefficient (a) Find the least-squares regression line treating number of absences as the explanatory variable and the final exam score as the response variable. y = -2.771 x+ 88.290 (Round to three decimal places as needed.) (b) Interpret the slope and the y-intercept, if appropriate. Choose the correct answer below and fill in any answer boxes in your choice. (Round to three decimal places as needed.) O A. The average final exam score of students who miss no classes is It is not appropriate to interpret the slope. O B. For every additional absence, a student's final exam score drops points, on average. The average final exam score of students who miss no classes is O C. For every additional absence, a student's final exam score drops points, on average. It is not appropriate to interpret the y-intercept. O D. It is not appropriate to interpret the slope or the y-intercept.

College Algebra
7th Edition
ISBN:9781305115545
Author:James Stewart, Lothar Redlin, Saleem Watson
Publisher:James Stewart, Lothar Redlin, Saleem Watson
Chapter1: Equations And Graphs
Section: Chapter Questions
Problem 10T: Olympic Pole Vault The graph in Figure 7 indicates that in recent years the winning Olympic men’s...

Related questions
Question
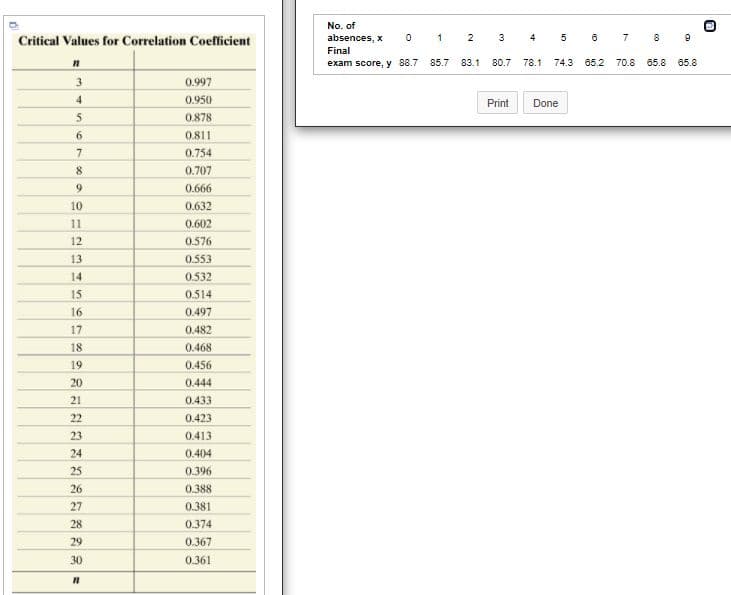
Transcribed Image Text:No. of
Critical Values for Correlation Coefficient
absences, x
1
2
3
4 5
Final
exam score, y 88.7 85.7
83.1
80.7
78.1
74.3
65.2 70.8
65.8 65.8
3
0.997
4.
0.950
Print
Done
5
0.878
0.811
7.
0.754
8
0.707
9
0.666
10
0.632
11
0.602
12
0.576
13
0.553
14
0.532
15
0.514
16
0.497
17
0.482
18
0.468
19
0.456
20
0.444
21
0.433
22
0.423
23
0.413
24
0.404
25
0.396
26
0.388
27
0.381
28
0.374
29
0.367
30
0.361
co
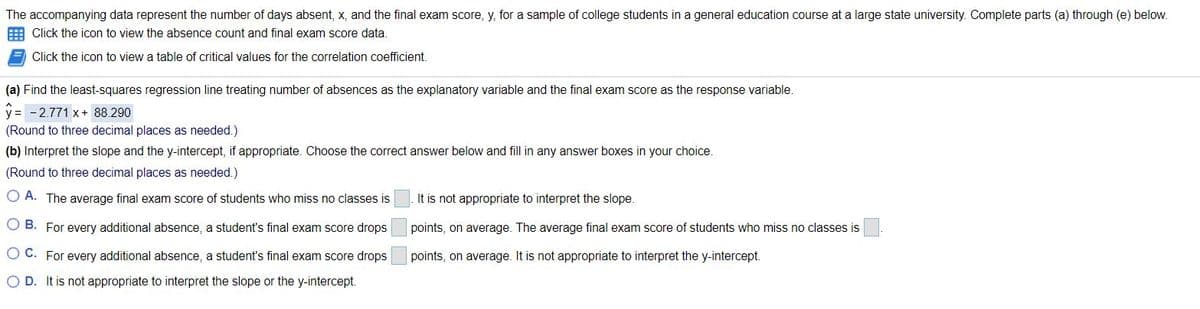
Transcribed Image Text:The accompanying data represent the number of days absent, x, and the final exam score, y, for a sample of college students in a general education course at a large state university. Complete parts (a) through (e) below.
E Click the icon to view the absence count and final exam score data.
Click the icon to view a table of critical values for the correlation coefficient.
(a) Find the least-squares regression line treating number of absences as the explanatory variable and the final exam score as the response variable.
y = -2.771 x+ 88.290
(Round to three decimal places as needed.)
(b) Interpret the slope and the y-intercept, if appropriate. Choose the correct answer below and fill in any answer boxes in your choice.
(Round to three decimal places as needed.)
A. The average final exam score of students who miss no classes is
It is not appropriate to interpret the slope.
O B. For every additional absence, a student's final exam score drops
points, on average. The average final exam score of students who miss no classes is
O C. For every additional absence, a student's final exam score drops
points, on average. It is not appropriate to interpret the y-intercept.
O D. It is not appropriate to interpret the slope or the y-intercept.
Expert Solution
This question has been solved!
Explore an expertly crafted, step-by-step solution for a thorough understanding of key concepts.

This is a popular solution!

Trending now
This is a popular solution!

Step by step
Solved in 3 steps with 2 images

Knowledge Booster


Learn more about
Need a deep-dive on the concept behind this application? Look no further. Learn more about this topic, statistics and related others by exploring similar questions and additional content below.Recommended textbooks for you
College Algebra
Algebra
ISBN:
9781305115545
Author:
James Stewart, Lothar Redlin, Saleem Watson
Publisher:
Cengage Learning

Linear Algebra: A Modern Introduction
Algebra
ISBN:
9781285463247
Author:
David Poole
Publisher:
Cengage Learning

College Algebra
Algebra
ISBN:
9781305115545
Author:
James Stewart, Lothar Redlin, Saleem Watson
Publisher:
Cengage Learning
Linear Algebra: A Modern Introduction
Algebra
ISBN:
9781285463247
Author:
David Poole
Publisher:
Cengage Learning

Glencoe Algebra 1, Student Edition, 9780079039897…
Algebra
ISBN:
9780079039897
Author:
Carter
Publisher:
McGraw Hill

Big Ideas Math A Bridge To Success Algebra 1: Stu…
Algebra
ISBN:
9781680331141
Author:
HOUGHTON MIFFLIN HARCOURT
Publisher:
Houghton Mifflin Harcourt