The accompanying data represent the number of days absent, x, and the final exam score, y, for a sample of college students in a general education course at a large state university. Complete parts (a) through (e) below. E Click the icon to view the absence count and final exam score data. Click the icon to view a table of critical values for the correlation coefficient. (a) Find the least-squares regression line treating number of absences as the explanatory variable and the final exam score as the response variable. (Round to three decimal places as needed.) (b) Interpret the slope and the y-intercept, if appropriate. Choose the correct answer below and fill in any answer boxes in your choice. (Round to three decimal places as needed.) Question View O A. For every additional absence, a student's final exam score drops points, on average. It is not appropriate to interpret the y-intercept. O B. For every additional absence, a student's final exam score drops points, on average. The average final exam score of students who miss no classes is. OC. The average final exam score of students who miss no classes is It is not appropriate to interpret the slope. Absences and final exam scores OD. It is not appropriate to interpret the slope or the y-intercept. (c) Predict the final exam score for a student who misses five class periods. No. of absences, x y 3 (Round to two decimal places as needed.) 3 4 7 8 Final Compute the residual. exam score, y 89.2 85.8 83.2 80.2 78.1 73.9 64.5 72.3 64.7 66.9 (Round to two decimal places as needed.) Is the final exam score above or below average for this number absences? Print Done O Below O Above di Draw th e
The accompanying data represent the number of days absent, x, and the final exam score, y, for a sample of college students in a general education course at a large state university. Complete parts (a) through (e) below. E Click the icon to view the absence count and final exam score data. Click the icon to view a table of critical values for the correlation coefficient. (a) Find the least-squares regression line treating number of absences as the explanatory variable and the final exam score as the response variable. (Round to three decimal places as needed.) (b) Interpret the slope and the y-intercept, if appropriate. Choose the correct answer below and fill in any answer boxes in your choice. (Round to three decimal places as needed.) Question View O A. For every additional absence, a student's final exam score drops points, on average. It is not appropriate to interpret the y-intercept. O B. For every additional absence, a student's final exam score drops points, on average. The average final exam score of students who miss no classes is. OC. The average final exam score of students who miss no classes is It is not appropriate to interpret the slope. Absences and final exam scores OD. It is not appropriate to interpret the slope or the y-intercept. (c) Predict the final exam score for a student who misses five class periods. No. of absences, x y 3 (Round to two decimal places as needed.) 3 4 7 8 Final Compute the residual. exam score, y 89.2 85.8 83.2 80.2 78.1 73.9 64.5 72.3 64.7 66.9 (Round to two decimal places as needed.) Is the final exam score above or below average for this number absences? Print Done O Below O Above di Draw th e

Linear Algebra: A Modern Introduction
4th Edition
ISBN:9781285463247
Author:David Poole
Publisher:David Poole
Chapter7: Distance And Approximation
Section7.3: Least Squares Approximation
Problem 31EQ

Related questions
Question
Transcribed Image Text:The accompanying data represent the number of days absent, x, and the final exam score, y, for a sample of college students in a general education course at a large state university. Complete parts (a) through (e) below.
Click the icon to view the absence count and final exam score data.
Click the icon to view a table of critical values for the correlation coefficient.
.....
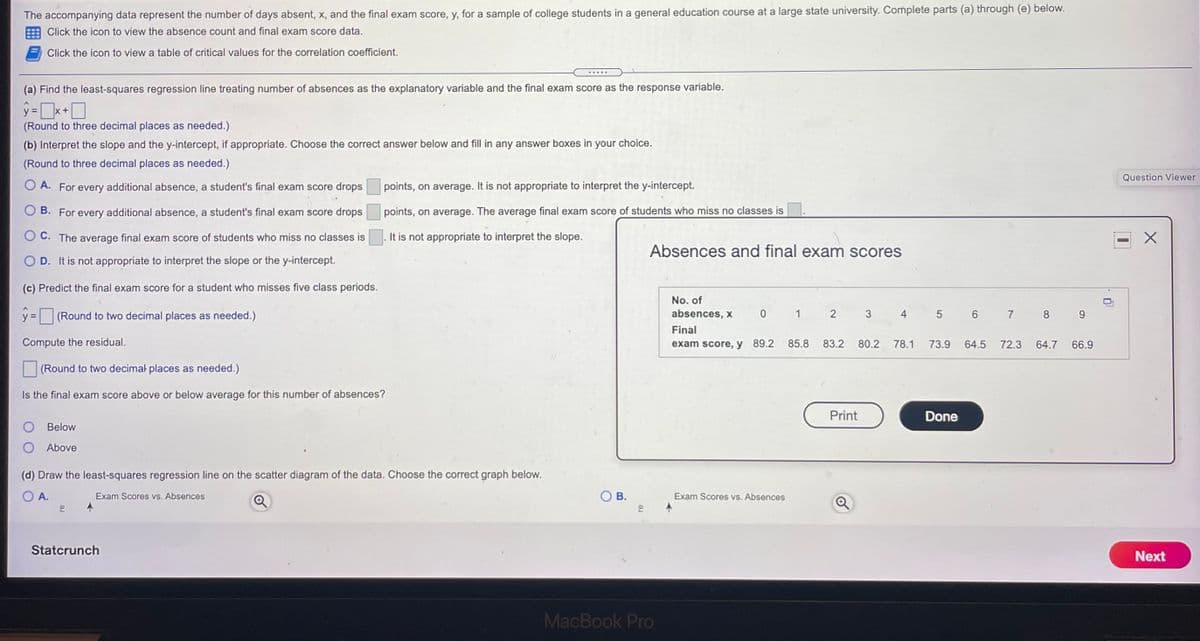
(a) Find the least-squares regression line treating number of absences as the explanatory variable and the final exam score as the response variable.
%3D
+
(Round to three decimal places as needed.)
(b) Interpret the slope and the y-intercept, if appropriate. Choose the correct answer below and fill in any answer boxes in your choice.
(Round to three decimal places as needed.)
Question Viewer
O A. For every additional absence, a student's final exam score drops
points, on average. It is not appropriate to interpret the y-intercept.
B. For every additional absence, a student's final exam score drops
points, on average. The average final exam score of students who miss no classes is
O C. The average final exam score of students who miss no classes is
It is not appropriate to interpret the slope.
Absences and final exam scores
O D. It is not appropriate to interpret the slope or the y-intercept.
(c) Predict the final exam score for a student who misses five class periods.
No. of
y = (Round to two decimal places as needed.)
absences, x
1
4
5 6
7
8.
Final
Compute the residual.
exam score, y 89.2
85.8
83.2
80.2
78.1
73.9
64.5
72.3
64.7
66.9
(Round to two decimal places as needed.)
Is the final exam score above or below average for this number of absences?
Print
Done
Below
Above
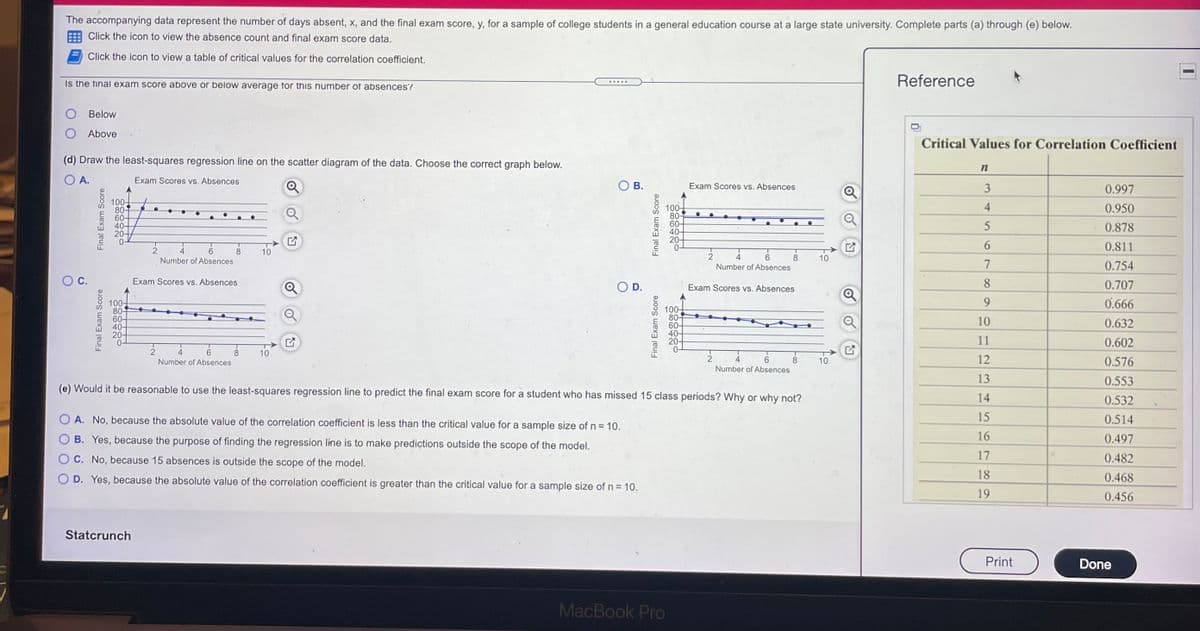
(d) Draw the least-squares regression line on the scatter diagram of the data. Choose the correct graph below.
O A.
Exam Scores vs. Absences
В.
Exam Scores vs. Absences
Statcrunch
Next
MacBook Pro
3.
2.
B.
Transcribed Image Text:The accompanying data represent the number of days absent, x, and the final exam score, y, for a sample of college students in a general education course at a large state university. Complete parts (a) through (e) below.
E Click the icon to view the absence count and final exam score data.
Click the icon to view a table of critical values for the correlation coefficient.
Is the final exam score above or below average for this number of absences?
Reference
.....
Below
Above
Critical Values for Correlation Coefficient
(d) Draw the least-squares regression line on the scatter diagram of the data. Choose the correct graph below.
A.
Exam Scores vs. Absences
OB.
Exam Scores vs. Absences
0.997
100-
80-
60-
40-
20-
0-
4
0.950
100-
80-
60-
40-
20-
0-
0.878
6.
0.811
6.
8.
Number of Absences
8.
Number of Absences
10
7
0.754
Exam Scores vs. Absences
OD.
Exam Scores vs. Absences
8
0.707
9.
0.666
100-
80-
60-
40-
20-
100-
80-
60-
40-
20-
0-
10
0.632
11
0.602
2
4
8.
Number of Absences
10
2
12
6.
Number of Absences
8.
10
0.576
13
0.553
(e) Would it be reasonable to use the least-squares regression line to predict the final exam score for a student who has missed 15 class periods? Why or why not?
14
0.532
A. No, because the absolute value of the correlation coefficient is less than the critical value for a sample size of n = 10.
15
0.514
B. Yes, because the purpose of finding the regression line is to make predictions outside the scope of the model.
16
0.497
C. No, because 15 absences is outside the scope of the model.
17
0.482
D. Yes, because the absolute value of the correlation coefficient is greater than the critical value for a sample size of n = 10.
18
0.468
19
0.456
Statcrunch
Print
Done
MacBook Pro
Final Exam Score
Final Exam Score
Final Exam Score
Final Exam Score
of
Expert Solution
This question has been solved!
Explore an expertly crafted, step-by-step solution for a thorough understanding of key concepts.

This is a popular solution!

Trending now
This is a popular solution!

Step by step
Solved in 2 steps

Recommended textbooks for you
Linear Algebra: A Modern Introduction
Algebra
ISBN:
9781285463247
Author:
David Poole
Publisher:
Cengage Learning

Glencoe Algebra 1, Student Edition, 9780079039897…
Algebra
ISBN:
9780079039897
Author:
Carter
Publisher:
McGraw Hill

Big Ideas Math A Bridge To Success Algebra 1: Stu…
Algebra
ISBN:
9781680331141
Author:
HOUGHTON MIFFLIN HARCOURT
Publisher:
Houghton Mifflin Harcourt
Linear Algebra: A Modern Introduction
Algebra
ISBN:
9781285463247
Author:
David Poole
Publisher:
Cengage Learning
Glencoe Algebra 1, Student Edition, 9780079039897…
Algebra
ISBN:
9780079039897
Author:
Carter
Publisher:
McGraw Hill
Big Ideas Math A Bridge To Success Algebra 1: Stu…
Algebra
ISBN:
9781680331141
Author:
HOUGHTON MIFFLIN HARCOURT
Publisher:
Houghton Mifflin Harcourt