The accompanying data represent the number of days absent, x, and the final exam score, y, for a sample of college students in a general education course at a large state university. Complete parts (a) through (e) below. Click the icon to view the absence count and final exam score data. Click the icon to view a table of critical values for the correlation coefficient.
The accompanying data represent the number of days absent, x, and the final exam score, y, for a sample of college students in a general education course at a large state university. Complete parts (a) through (e) below. Click the icon to view the absence count and final exam score data. Click the icon to view a table of critical values for the correlation coefficient.

Functions and Change: A Modeling Approach to College Algebra (MindTap Course List)
6th Edition
ISBN:9781337111348
Author:Bruce Crauder, Benny Evans, Alan Noell
Publisher:Bruce Crauder, Benny Evans, Alan Noell
Chapter3: Straight Lines And Linear Functions
Section3.CR: Chapter Review Exercises
Problem 15CR: Life Expectancy The following table shows the average life expectancy, in years, of a child born in...

Related questions
Question
Transcribed Image Text:3:16
K
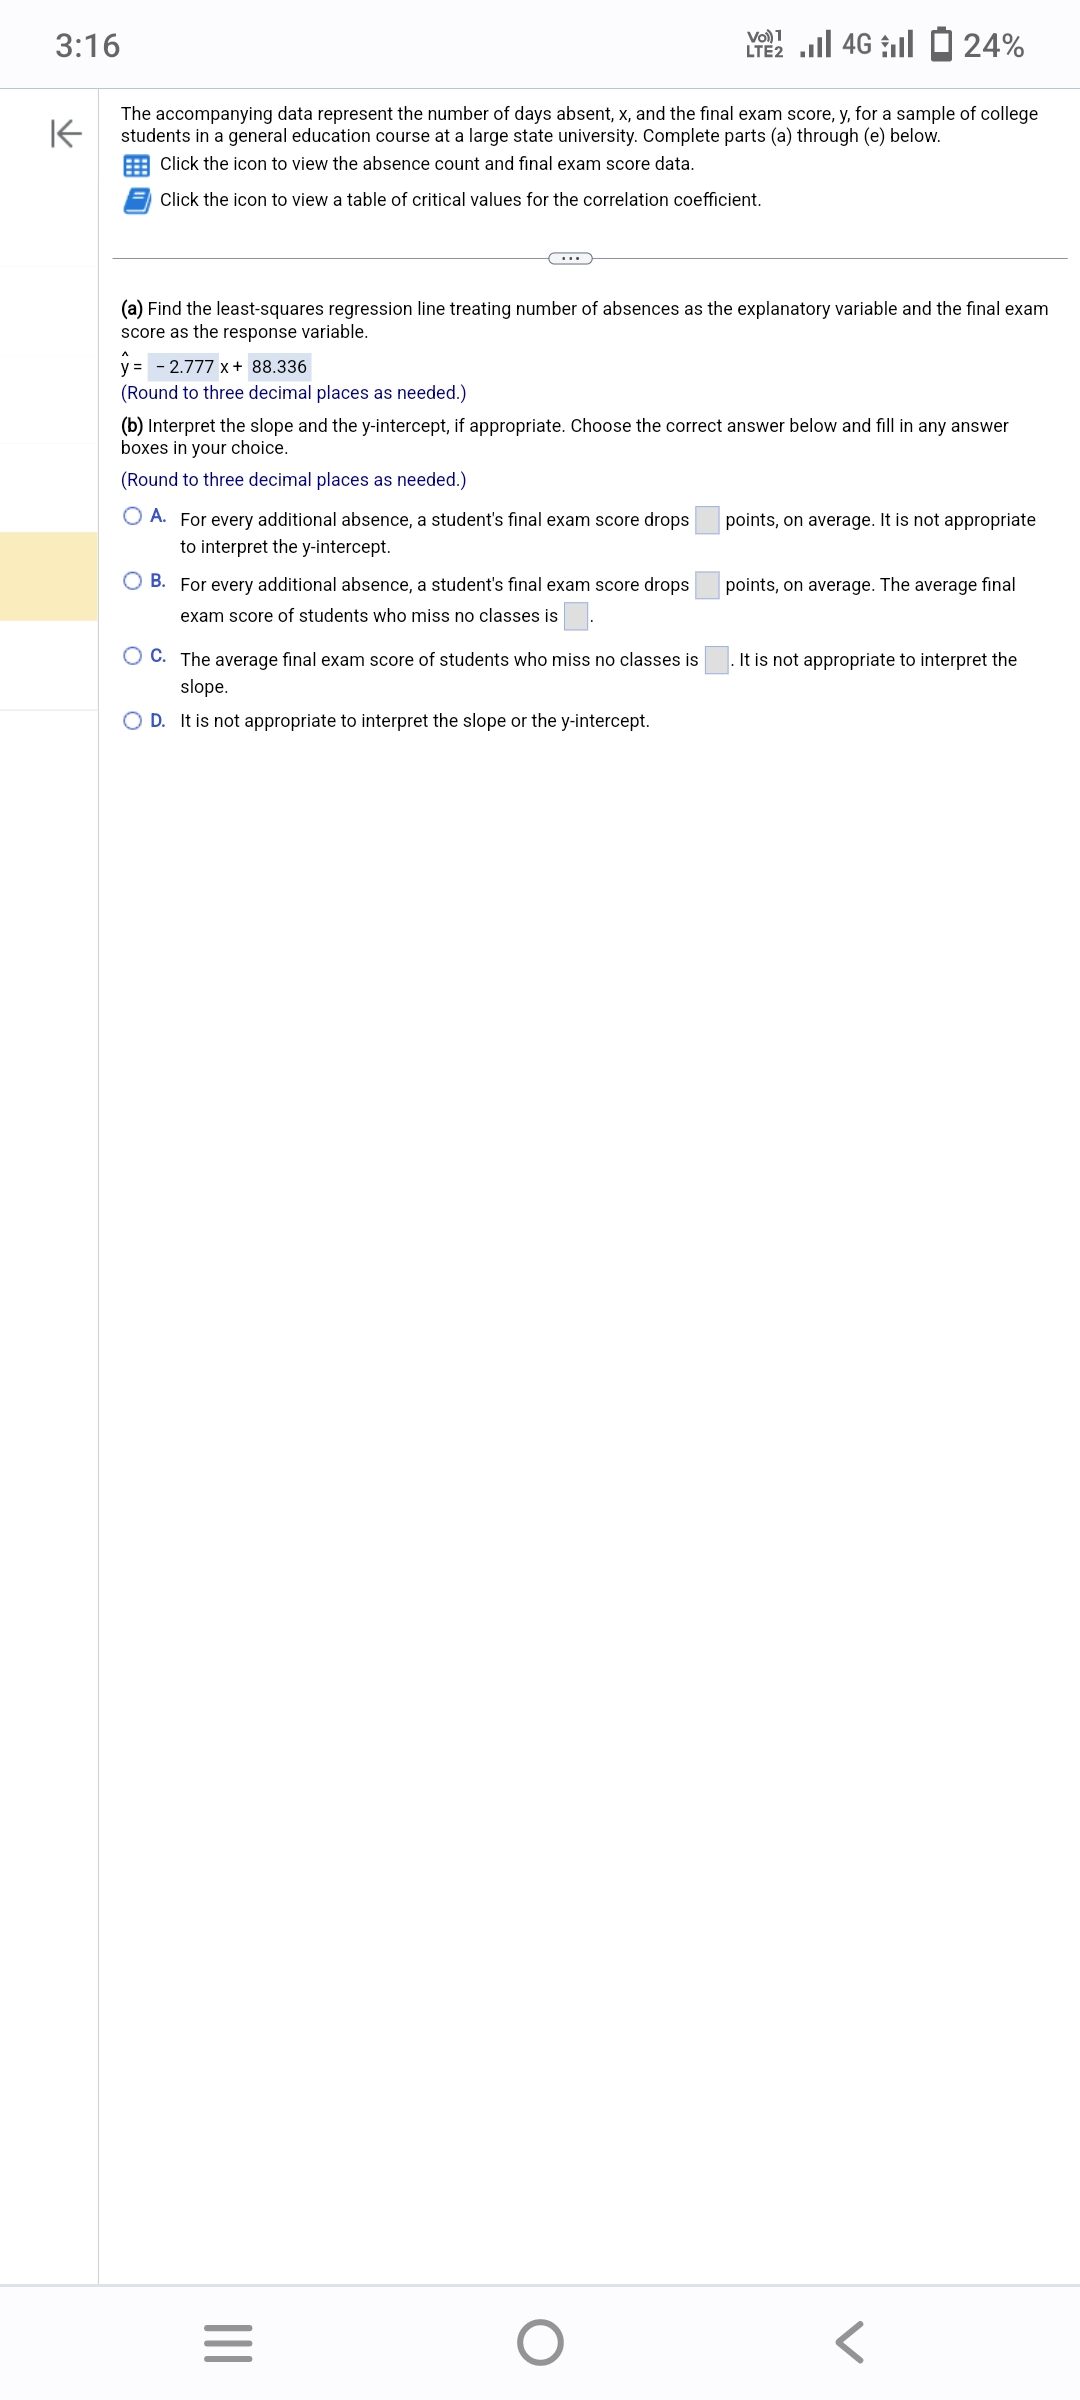
The accompanying data represent the number of days absent, x, and the final exam score, y, for a sample of college
students in a general education course at a large state university. Complete parts (a) through (e) below.
Click the icon to view the absence count and final exam score data.
Click the icon to view a table of critical values for the correlation coefficient.
(a) Find the least-squares regression line treating number of absences as the explanatory variable and the final exam
score as the response variable.
y = -2.777 x + 88.336
(Round to three decimal places as needed.)
(b) Interpret the slope and the y-intercept, if appropriate. Choose the correct answer below and fill in any answer
boxes in your choice.
(Round to three decimal places as needed.)
O A. For every additional absence, a student's final exam score drops
to interpret the y-intercept.
O B. For every additional absence, a student's final exam score drops
exam score of students who miss no classes is
OC. The average final exam score of students who miss no classes is
slope.
OD. It is not appropriate to interpret the slope or the y-intercept.
Vo) 1
LTE 4G 24%
|||
=
O
points, on average. It is not appropriate
points, on average. The average final
It is not appropriate to interpret the
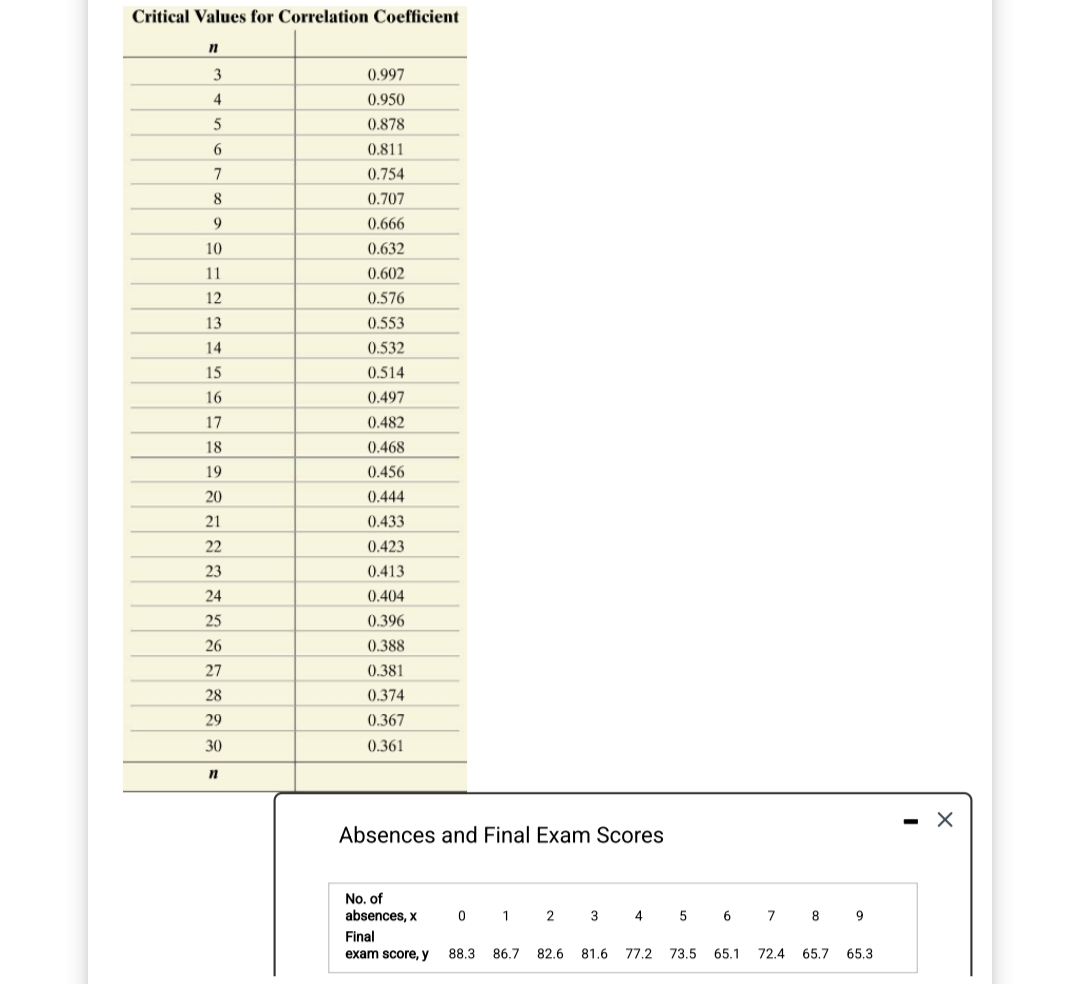
Transcribed Image Text:Critical Values for Correlation Coefficient
n
3
4
5
6
7
8
9
10
11
12
13
14
15
16
17
18
19
20
21
22
23
24
25
26
27
28
29
30
n
0.997
0.950
0.878
0.811
0.754
0.707
0.666
0.632
0.602
0.576
0.553
0.532
0.514
0.497
0.482
0.468
0.456
0.444
0.433
0.423
0.413
0.404
0.396
0.388
0.381
0.374
0.367
0.361
Absences and Final Exam Scores
No. of
absences, x
0 1 2 3 4 5 6 7 8 9
Final
exam score, y 88.3 86.7
82.6 81.6 77.2 73.5
65.1
72.4 65.7 65.3
-
X
Expert Solution
This question has been solved!
Explore an expertly crafted, step-by-step solution for a thorough understanding of key concepts.

Step by step
Solved in 2 steps

Recommended textbooks for you
Functions and Change: A Modeling Approach to Coll…
Algebra
ISBN:
9781337111348
Author:
Bruce Crauder, Benny Evans, Alan Noell
Publisher:
Cengage Learning

College Algebra
Algebra
ISBN:
9781305115545
Author:
James Stewart, Lothar Redlin, Saleem Watson
Publisher:
Cengage Learning

Functions and Change: A Modeling Approach to Coll…
Algebra
ISBN:
9781337111348
Author:
Bruce Crauder, Benny Evans, Alan Noell
Publisher:
Cengage Learning
College Algebra
Algebra
ISBN:
9781305115545
Author:
James Stewart, Lothar Redlin, Saleem Watson
Publisher:
Cengage Learning

Algebra & Trigonometry with Analytic Geometry
Algebra
ISBN:
9781133382119
Author:
Swokowski
Publisher:
Cengage

Glencoe Algebra 1, Student Edition, 9780079039897…
Algebra
ISBN:
9780079039897
Author:
Carter
Publisher:
McGraw Hill