The accompanying data shows the weekly purchases of printers at a particular electronic store. Using a= 0.05, perform a chi-square test to determine if the number of printers sold per week follows a normal probability distribution. Note that x = 11.2 and S= 4.4 1 Click the icon to view the weekly purchases of printers. State the appropriate null and alternative hypotheses. What is the null hypothesis? O A. Ho The mean number of weekly printers purchased is 11.2. O B. Ho: The mean number of weekly printers purchased is not 11.2.
The accompanying data shows the weekly purchases of printers at a particular electronic store. Using a= 0.05, perform a chi-square test to determine if the number of printers sold per week follows a normal probability distribution. Note that x = 11.2 and S= 4.4 1 Click the icon to view the weekly purchases of printers. State the appropriate null and alternative hypotheses. What is the null hypothesis? O A. Ho The mean number of weekly printers purchased is 11.2. O B. Ho: The mean number of weekly printers purchased is not 11.2.

MATLAB: An Introduction with Applications
6th Edition
ISBN:9781119256830
Author:Amos Gilat
Publisher:Amos Gilat
Chapter1: Starting With Matlab
Section: Chapter Questions
Problem 1P

Related questions
Question
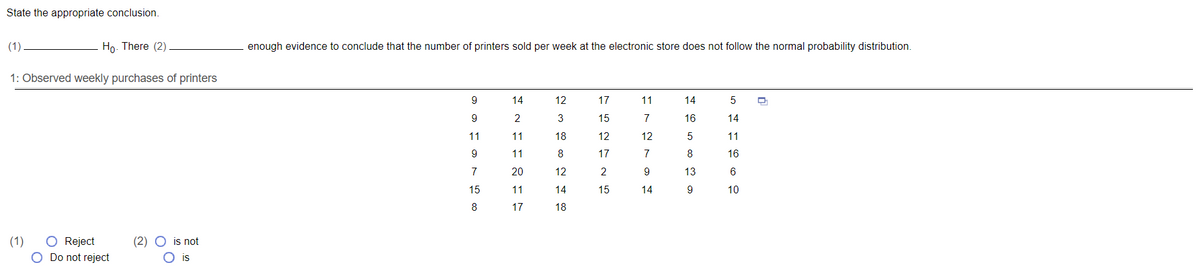
Transcribed Image Text:State the appropriate conclusion.
(1)
Ho. There (2)
enough evidence to conclude that the number of printers sold per week at the electronic store does not follow the normal probability distribution.
1: Observed weekly purchases of printers
9
14
12
17
11
14
9
2
15
7
16
14
11
11
18
12
12
11
9
11
8
17
7
8
16
7
20
12
2
9
13
6
15
11
14
15
14
10
8
17
18
(1)
(2) O is not
Reject
Do not reject
is
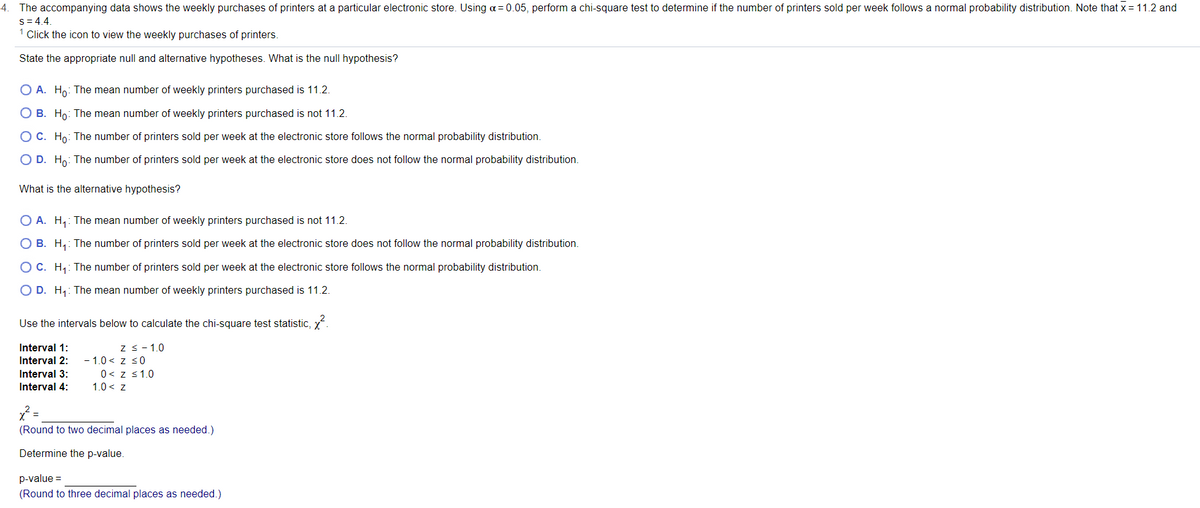
Transcribed Image Text:4. The accompanying data shows the weekly purchases of printers at a particular electronic store. Using a = 0.05, perform a chi-square test to determine if the number of printers sold per week follows a normal probability distribution. Note that x = 11.2 and
s= 4.4.
1 Click the icon to view the weekly purchases of printers.
State the appropriate null and alternative hypotheses. What is the null hypothesis?
O A. Ho: The mean number of weekly printers purchased is 11.2.
O B. Ho: The mean number of weekly printers purchased is not 11.2.
O C. Ho: The number of printers sold per week at the electronic store follows the normal probability distribution.
O D. Ho: The number of printers sold per week at the electronic store does not follow the normal probability distribution.
What is the alternative hypothesis?
O A. H,: The mean number of weekly printers purchased is not 11.2.
O B. H,: The number of printers sold per week at the electronic store does not follow the normal probability distribution.
O C. H,: The number of printers sold per week at the electronic store follows the normal probability distribution.
O D. H1: The mean number of weekly printers purchased is 11.2.
Use the intervals below to calculate the chi-square test statistic, x.
z s-1.0
- 1.0 < z <0
0< z <1.0
1.0 < z
Interval 1:
Interval 2:
Interval 3:
Interval 4:
=
(Round to two decimal places as needed.)
Determine the p-value.
p-value =
(Round to three decimal places as needed.)
Expert Solution
This question has been solved!
Explore an expertly crafted, step-by-step solution for a thorough understanding of key concepts.

This is a popular solution!

Trending now
This is a popular solution!

Step by step
Solved in 3 steps

Recommended textbooks for you
MATLAB: An Introduction with Applications
Statistics
ISBN:
9781119256830
Author:
Amos Gilat
Publisher:
John Wiley & Sons Inc

Probability and Statistics for Engineering and th…
Statistics
ISBN:
9781305251809
Author:
Jay L. Devore
Publisher:
Cengage Learning

Statistics for The Behavioral Sciences (MindTap C…
Statistics
ISBN:
9781305504912
Author:
Frederick J Gravetter, Larry B. Wallnau
Publisher:
Cengage Learning
MATLAB: An Introduction with Applications
Statistics
ISBN:
9781119256830
Author:
Amos Gilat
Publisher:
John Wiley & Sons Inc
Probability and Statistics for Engineering and th…
Statistics
ISBN:
9781305251809
Author:
Jay L. Devore
Publisher:
Cengage Learning
Statistics for The Behavioral Sciences (MindTap C…
Statistics
ISBN:
9781305504912
Author:
Frederick J Gravetter, Larry B. Wallnau
Publisher:
Cengage Learning

Elementary Statistics: Picturing the World (7th E…
Statistics
ISBN:
9780134683416
Author:
Ron Larson, Betsy Farber
Publisher:
PEARSON

The Basic Practice of Statistics
Statistics
ISBN:
9781319042578
Author:
David S. Moore, William I. Notz, Michael A. Fligner
Publisher:
W. H. Freeman

Introduction to the Practice of Statistics
Statistics
ISBN:
9781319013387
Author:
David S. Moore, George P. McCabe, Bruce A. Craig
Publisher:
W. H. Freeman