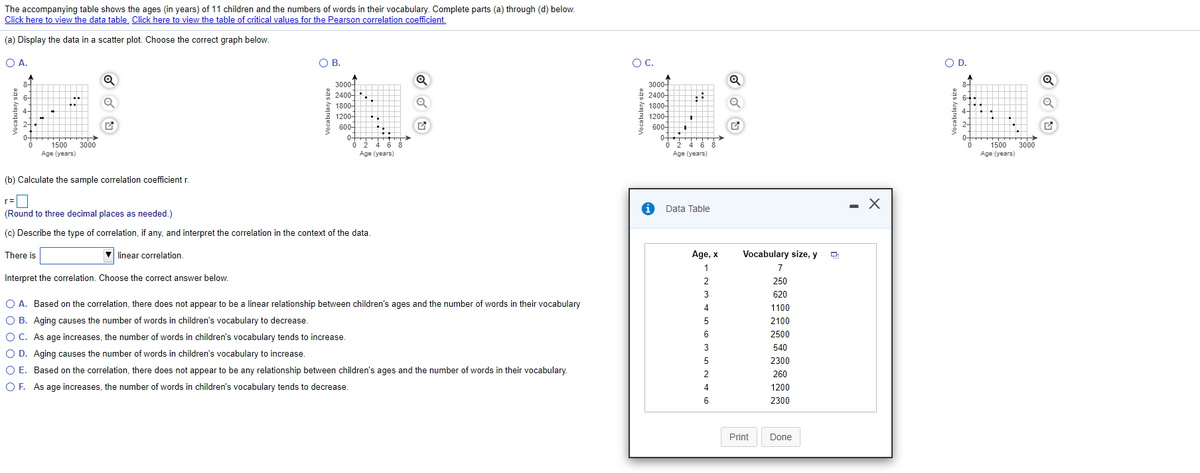
The accompanying table shows the ages (in years) of 11 children and the numbers of words in their vocabulary. Complete parts (a) through (d) below. Click here to view the data table. Click here to view the table of critical values for the Pearson correlation coefficiant., (a) Display the data in a scatter plot. Choose the correct graph below. O A OB. O B. OC. OD. 3000 2400 1800 1200- 3000 2400- 1800 1200 600 i500 3000 Age (years) 1500 3000 Age (years) Age (years) Age (years) (b) Calculate the sample correlation coefficient r. (Round to three decimal places as needed.) O Data Table - X (c) Describe the type of correlation, If any, and interpret the correlation in the context of the data. There is V linear correlation. Age, x Vocabulary size, y 1 7 Interpret the correlation. Choose the correct answer below. 250 3 620 O A. Based on the correlation, there does not appear to be a linear relationship between children's ages and the number of words in their vocabulary O B. Aging causes the number of words in children's vocabulary to decrease. OC. As age increases, the number of words in children's vocabulary tends to increase. OD. Aging causes the number of words in children's vocabulary to increase. O E. Based on the correlation, there does not appear to be any relationship between children's ages and the number of words in their vocabulary. OF. As age increases, the number of words in children's vocabulary tends to decrease. 4 1100 5 2100 6 2500 3 540 5 2300 2 260 4 1200 2300 Print Done


Inverse Normal Distribution
The method used for finding the corresponding z-critical value in a normal distribution using the known probability is said to be an inverse normal distribution. The inverse normal distribution is a continuous probability distribution with a family of two parameters.
Mean, Median, Mode
It is a descriptive summary of a data set. It can be defined by using some of the measures. The central tendencies do not provide information regarding individual data from the dataset. However, they give a summary of the data set. The central tendency or measure of central tendency is a central or typical value for a probability distribution.
Z-Scores
A z-score is a unit of measurement used in statistics to describe the position of a raw score in terms of its distance from the mean, measured with reference to standard deviation from the mean. Z-scores are useful in statistics because they allow comparison between two scores that belong to different normal distributions.


Trending now
This is a popular solution!

Step by step
Solved in 3 steps with 1 images


