The accompanying table shows the numbers of male and female students in a particular country who received bachelor's degrees in business in a recent year. Complete parts (a) and (b) below H Click the icon to view the data on business degrees. (a) Find the probability that a randomly selected student is male, given that the student received a business degree. The probability that a randomly selected student is male, given that the student received a business degree, is. (Round to three decimal places as needed.) Business Graduates Business degrees Nonbusiness degrees Total Male Female Total 190,719 178,719 369,438 621,538 911,502 1,533,040 812,257 1,090,221 1,902,478 Enter your answer in the answer box and then Print Done part remaining Clear All Check Answer P Type here to search a 12:16 A 99+ 4/4/202 10 4- 144 米 esc %24 4. % %23 3. @ 6. 7. 8. 6. Y. W tab
The accompanying table shows the numbers of male and female students in a particular country who received bachelor's degrees in business in a recent year. Complete parts (a) and (b) below H Click the icon to view the data on business degrees. (a) Find the probability that a randomly selected student is male, given that the student received a business degree. The probability that a randomly selected student is male, given that the student received a business degree, is. (Round to three decimal places as needed.) Business Graduates Business degrees Nonbusiness degrees Total Male Female Total 190,719 178,719 369,438 621,538 911,502 1,533,040 812,257 1,090,221 1,902,478 Enter your answer in the answer box and then Print Done part remaining Clear All Check Answer P Type here to search a 12:16 A 99+ 4/4/202 10 4- 144 米 esc %24 4. % %23 3. @ 6. 7. 8. 6. Y. W tab

Chapter8: Sequences, Series,and Probability
Section: Chapter Questions
Problem 18T: You attend a karaoke night and hope to hear your favorite song. The karaoke song book has 300...

Related questions

Concept explainers
Contingency Table
A contingency table can be defined as the visual representation of the relationship between two or more categorical variables that can be evaluated and registered. It is a categorical version of the scatterplot, which is used to investigate the linear relationship between two variables. A contingency table is indeed a type of frequency distribution table that displays two variables at the same time.
Binomial Distribution
Binomial is an algebraic expression of the sum or the difference of two terms. Before knowing about binomial distribution, we must know about the binomial theorem.
Topic Video
Question
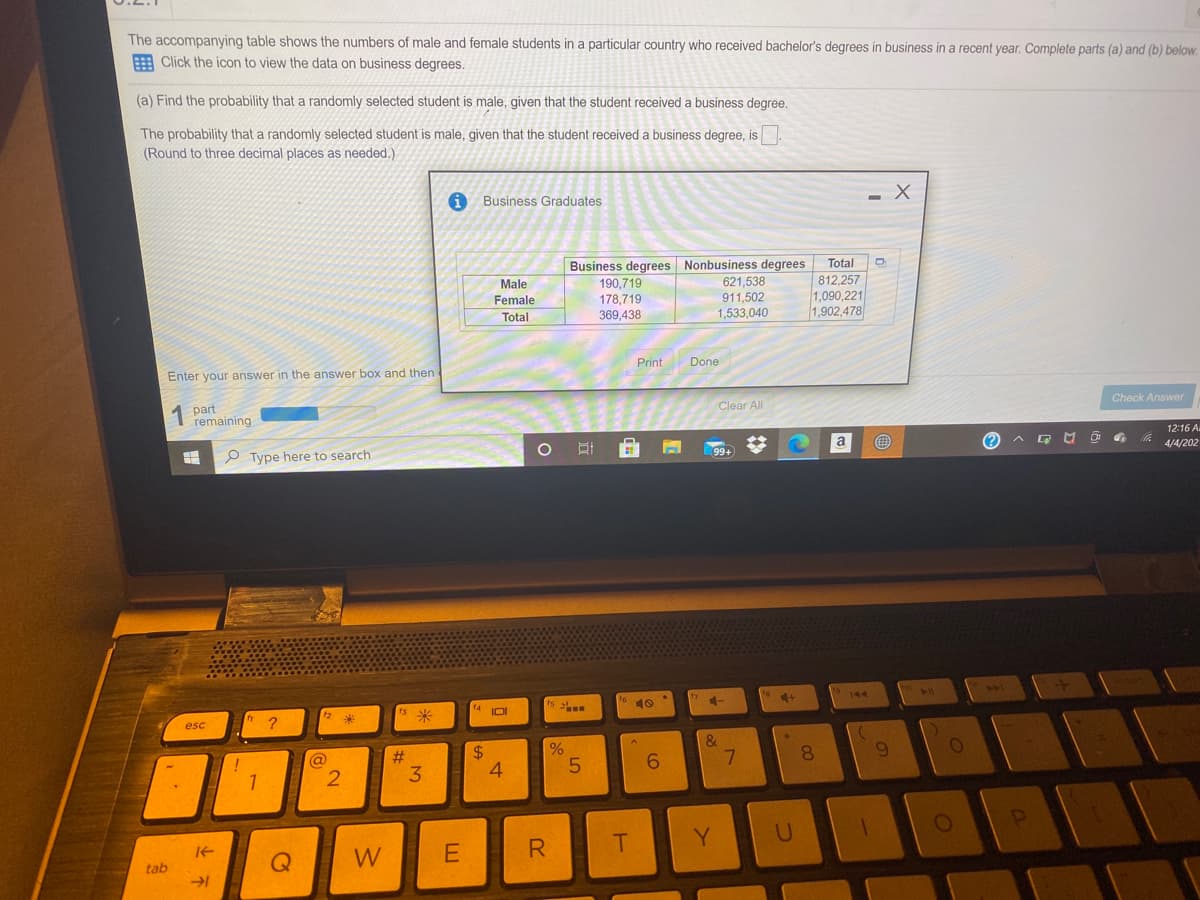
Transcribed Image Text:The accompanying table shows the numbers of male and female students in a particular country who received bachelor's degrees in business in a recent year. Complete parts (a) and (b) below.
A Click the icon to view the data on business degrees.
(a) Find the probability that a randomly selected student is male, given that the student received a business degree.
The probability that a randomly selected student is male, given that the student received a business degree, is
(Round to three decimal places as needed.)
Business Graduates
Business degrees Nonbusiness degrees
190,719
178,719
Total
Male
621,538
911,502
1,533,040
812,257
1,090,221
1,902,478
Female
Total
369,438
Enter your answer in the answer box and then
Print
Done
part
remaining
Clear All
Check Answer
P Type here to search
a
12:16 A
99+
4/4/202
21
s 米
10
4+
144
12
IOI
esc
%24
4
3
9.
7.
8.
T.
Y
U
OP
tab
W
Expert Solution
This question has been solved!
Explore an expertly crafted, step-by-step solution for a thorough understanding of key concepts.

This is a popular solution!

Trending now
This is a popular solution!

Step by step
Solved in 2 steps with 2 images

Knowledge Booster


Learn more about
Need a deep-dive on the concept behind this application? Look no further. Learn more about this topic, statistics and related others by exploring similar questions and additional content below.Recommended textbooks for you

Holt Mcdougal Larson Pre-algebra: Student Edition…
Algebra
ISBN:
9780547587776
Author:
HOLT MCDOUGAL
Publisher:
HOLT MCDOUGAL
Holt Mcdougal Larson Pre-algebra: Student Edition…
Algebra
ISBN:
9780547587776
Author:
HOLT MCDOUGAL
Publisher:
HOLT MCDOUGAL