The administrative office of a hospital claims that the mean waiting time for patients to get treatment in its emergency ward is 25 minutes. A random sample of 16 patients who received treatment in the emergency ward of this hospital produced a mean waiting time of 27.5 minutes. Using a 1% significance level, test whether the mean waiting time at the emergency ward is different from 25 minutes. Assume that the waiting times for all patients at this emergency ward have a normal distribution and the population standard deviation is 4.8 minutes. 1)Step 1: State the null and alternative hypotheses. )Step 2: Write down the appropriate test statistics(formula), but first check assumptions
The administrative office of a hospital claims that the mean waiting time for patients to get treatment in its emergency ward is 25 minutes. A random sample of 16 patients who received treatment in the emergency ward of this hospital produced a mean waiting time of 27.5 minutes. Using a 1% significance level, test whether the mean waiting time at the emergency ward is different from 25 minutes. Assume that the waiting times for all patients at this emergency ward have a normal distribution and the population standard deviation is 4.8 minutes. 1)Step 1: State the null and alternative hypotheses. )Step 2: Write down the appropriate test statistics(formula), but first check assumptions

Glencoe Algebra 1, Student Edition, 9780079039897, 0079039898, 2018
18th Edition
ISBN:9780079039897
Author:Carter
Publisher:Carter
Chapter10: Statistics
Section10.4: Distributions Of Data
Problem 7PPS

Related questions
Topic Video
Question
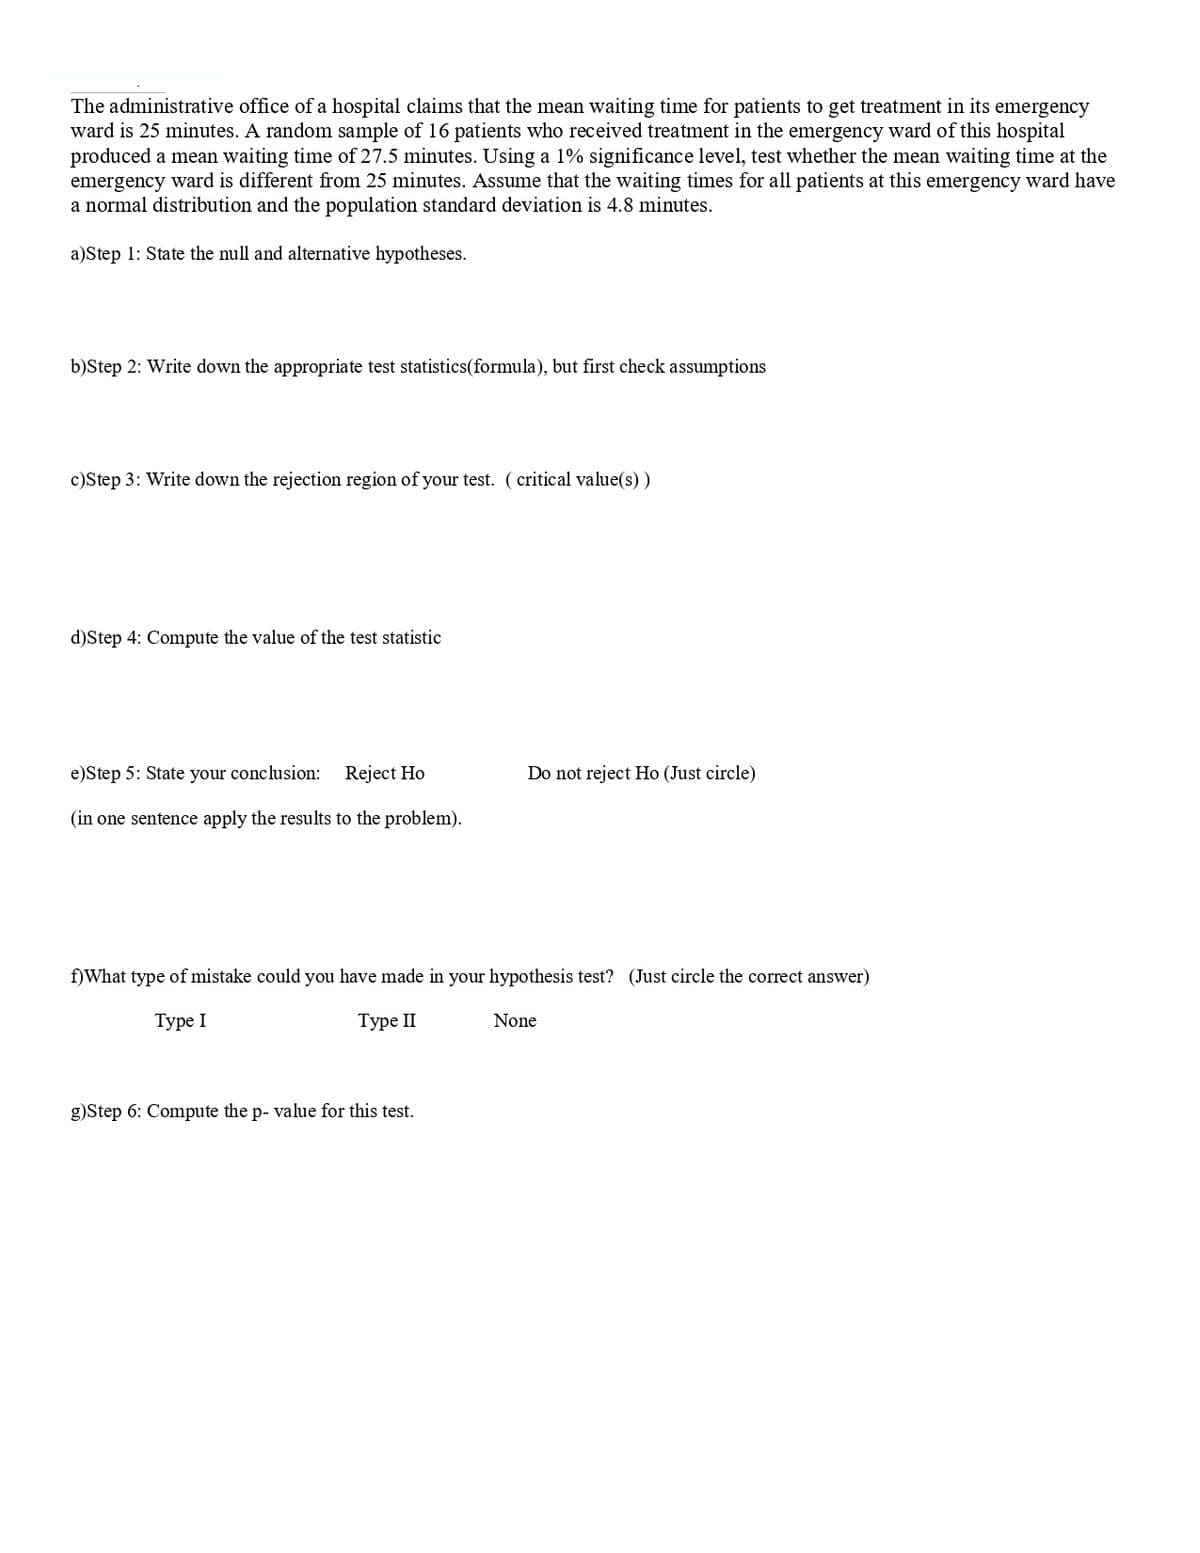
Transcribed Image Text:The administrative office of a hospital claims that the mean waiting time for patients to get treatment in its emergency
ward is 25 minutes. A random sample of 16 patients who received treatment in the emergency ward of this hospital
produced a mean waiting time of 27.5 minutes. Using a 1% significance level, test whether the mean waiting time at the
emergency ward is different from 25 minutes. Assume that the waiting times for all patients at this emergency ward have
a normal distribution and the population standard deviation is 4.8 minutes.
a)Step 1: State the null and alternative hypotheses.
b)Step 2: Write down the appropriate test statistics(formula), but first check assumptions
c)Step 3: Write down the rejection region of your test. (critical value(s) )
d)Step 4: Compute the value of the test statistic
e)Step 5: State your conclusion:
Reject Ho
Do not reject Ho (Just circle)
(in one sentence apply the results to the problem).
f)What type of mistake could you have made in your hypothesis test? (Just circle the correct answer)
Туре I
Туре П
None
g)Step 6: Compute the p- value for this test.
Expert Solution
This question has been solved!
Explore an expertly crafted, step-by-step solution for a thorough understanding of key concepts.

This is a popular solution!

Trending now
This is a popular solution!

Step by step
Solved in 2 steps with 3 images

Knowledge Booster


Learn more about
Need a deep-dive on the concept behind this application? Look no further. Learn more about this topic, statistics and related others by exploring similar questions and additional content below.Recommended textbooks for you
Glencoe Algebra 1, Student Edition, 9780079039897…
Algebra
ISBN:
9780079039897
Author:
Carter
Publisher:
McGraw Hill

College Algebra (MindTap Course List)
Algebra
ISBN:
9781305652231
Author:
R. David Gustafson, Jeff Hughes
Publisher:
Cengage Learning
Glencoe Algebra 1, Student Edition, 9780079039897…
Algebra
ISBN:
9780079039897
Author:
Carter
Publisher:
McGraw Hill
College Algebra (MindTap Course List)
Algebra
ISBN:
9781305652231
Author:
R. David Gustafson, Jeff Hughes
Publisher:
Cengage Learning