A college entrance exam company determined that a score of 24 on the mathematics portion of the exam suggests that a student is ready for college-level mathematics. To achieve this goal, the company recommends that students take a core curriculum of math courses in high school. Suppose a random sample of 250 students who completed this core set of courses results in a mean math score of 24.2 on the college entrance exam with a standard deviation of 3.3. Do these results suggest that students who complete the core curriculum are ready for college-level mathematics? That is, are they scoring above 24 on the mathematics portion of the exam? Complete parts a) through d) below. a) State the appropriate null and alternative hypotheses. Fill in the correct answers below. The appropriate null and alternative hypotheses are Ho: u = 24 versus H,: > 24. b) Verify that the requirements to perform the test using the t-distribution are satisfied. Check all that apply. O A. The sample size is larger than 30. O B. The students' test scores were independent of one another. O C. The sample data come from a population that is approximately normal. O D. A boxplot of the sample data shows no outliers. O E. The students were randomly sampled. O F. None of the requirements are satisfied.
A college entrance exam company determined that a score of 24 on the mathematics portion of the exam suggests that a student is ready for college-level mathematics. To achieve this goal, the company recommends that students take a core curriculum of math courses in high school. Suppose a random sample of 250 students who completed this core set of courses results in a mean math score of 24.2 on the college entrance exam with a standard deviation of 3.3. Do these results suggest that students who complete the core curriculum are ready for college-level mathematics? That is, are they scoring above 24 on the mathematics portion of the exam? Complete parts a) through d) below. a) State the appropriate null and alternative hypotheses. Fill in the correct answers below. The appropriate null and alternative hypotheses are Ho: u = 24 versus H,: > 24. b) Verify that the requirements to perform the test using the t-distribution are satisfied. Check all that apply. O A. The sample size is larger than 30. O B. The students' test scores were independent of one another. O C. The sample data come from a population that is approximately normal. O D. A boxplot of the sample data shows no outliers. O E. The students were randomly sampled. O F. None of the requirements are satisfied.

MATLAB: An Introduction with Applications
6th Edition
ISBN:9781119256830
Author:Amos Gilat
Publisher:Amos Gilat
Chapter1: Starting With Matlab
Section: Chapter Questions
Problem 1P

Related questions
Topic Video
Question
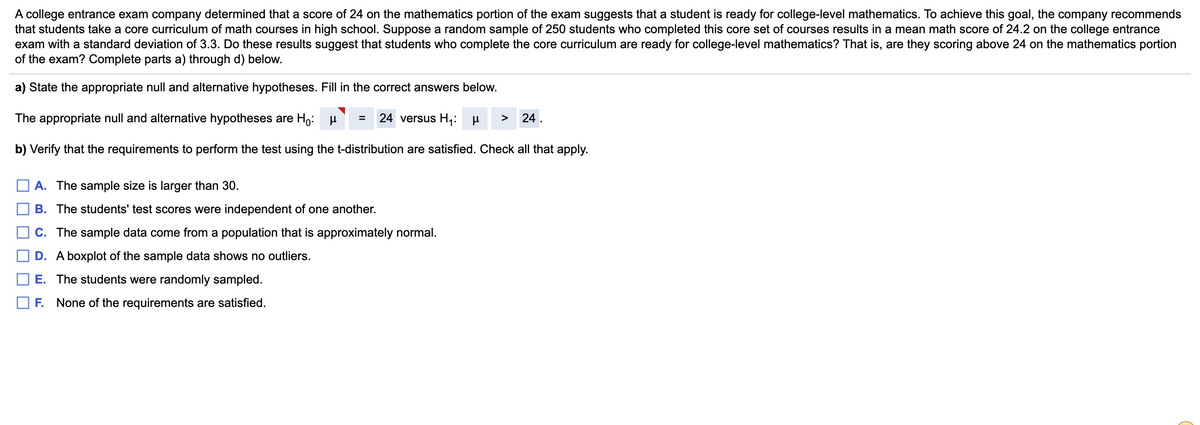
Transcribed Image Text:A college entrance exam company determined that a score of 24 on the mathematics portion of the exam suggests that a student is ready for college-level mathematics. To achieve this goal, the company recommends
that students take a core curriculum of math courses in high school. Suppose a random sample of 250 students who completed this core set of courses results in a mean math score of 24.2 on the college entrance
exam with a standard deviation of 3.3. Do these results suggest that students who complete the core curriculum are ready for college-level mathematics? That is, are they scoring above 24 on the mathematics portion
of the exam? Complete parts a) through d) below.
a) State the appropriate null and alternative hypotheses. Fill in the correct answers below.
The appropriate null and alternative hypotheses are Ho:
24 versus H,: P
24.
>
b) Verify that the requirements to perform the test using the t-distribution are satisfied. Check all that apply.
A. The sample size is larger than 30.
B. The students' test scores were independent of one another.
C. The sample data come from a population that is approximately normal.
D. A boxplot of the sample data shows no outliers.
E. The students were randomly sampled.
F. None of the requirements are satisfied.
Expert Solution
Step 1
Consider the following information-

Trending now
This is a popular solution!

Step by step
Solved in 3 steps

Knowledge Booster


Learn more about
Need a deep-dive on the concept behind this application? Look no further. Learn more about this topic, statistics and related others by exploring similar questions and additional content below.Recommended textbooks for you
MATLAB: An Introduction with Applications
Statistics
ISBN:
9781119256830
Author:
Amos Gilat
Publisher:
John Wiley & Sons Inc

Probability and Statistics for Engineering and th…
Statistics
ISBN:
9781305251809
Author:
Jay L. Devore
Publisher:
Cengage Learning

Statistics for The Behavioral Sciences (MindTap C…
Statistics
ISBN:
9781305504912
Author:
Frederick J Gravetter, Larry B. Wallnau
Publisher:
Cengage Learning
MATLAB: An Introduction with Applications
Statistics
ISBN:
9781119256830
Author:
Amos Gilat
Publisher:
John Wiley & Sons Inc
Probability and Statistics for Engineering and th…
Statistics
ISBN:
9781305251809
Author:
Jay L. Devore
Publisher:
Cengage Learning
Statistics for The Behavioral Sciences (MindTap C…
Statistics
ISBN:
9781305504912
Author:
Frederick J Gravetter, Larry B. Wallnau
Publisher:
Cengage Learning

Elementary Statistics: Picturing the World (7th E…
Statistics
ISBN:
9780134683416
Author:
Ron Larson, Betsy Farber
Publisher:
PEARSON

The Basic Practice of Statistics
Statistics
ISBN:
9781319042578
Author:
David S. Moore, William I. Notz, Michael A. Fligner
Publisher:
W. H. Freeman

Introduction to the Practice of Statistics
Statistics
ISBN:
9781319013387
Author:
David S. Moore, George P. McCabe, Bruce A. Craig
Publisher:
W. H. Freeman