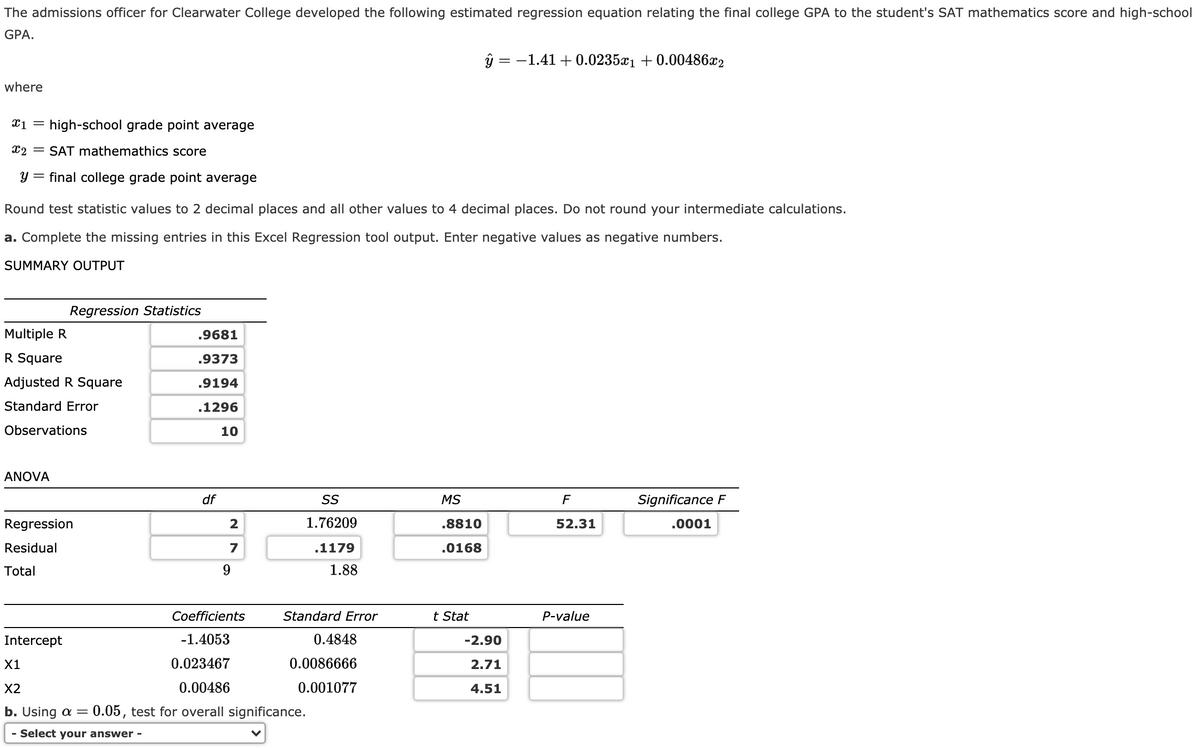
The admissions officer for Clearwater College developed the following estimated regression equation relating the final college GPA to the student's SAT mathematics score and high-school GPA. ŷ = -1.41 + 0.0235x1 + 0.00486x2 where T1 = high-school grade point average 22 = SAT mathemathics score y = final college grade point average Round test statistic values to 2 decimal places and all other values to 4 decimal places. Do not round your intermediate calculations. a. Complete the missing entries in this Excel Regression tool output. Enter negative values as negative numbers. SUMMARY OUTPUT Regression Statistics Multiple R R Square .9681 .9373 Adjusted R Square ,9194 Standard Error .1296 Observations 10 ANOVA df MS F Significance F Regression Residual Total 2 1.76209 .8810 52.31 .0001 .1179 .0168 9 1.88 Coefficients Standard Error t Stat P-value Intercept -1.4053 0.4848 -2.90 X1 0.023467 0.0086666 2.71 K2 0.00486 0.001077 4.51 b. Using a = 0.05, test for overall significance. - Select your answer -


Addition Rule of Probability
It simply refers to the likelihood of an event taking place whenever the occurrence of an event is uncertain. The probability of a single event can be calculated by dividing the number of successful trials of that event by the total number of trials.
Expected Value
When a large number of trials are performed for any random variable ‘X’, the predicted result is most likely the mean of all the outcomes for the random variable and it is known as expected value also known as expectation. The expected value, also known as the expectation, is denoted by: E(X).
Probability Distributions
Understanding probability is necessary to know the probability distributions. In statistics, probability is how the uncertainty of an event is measured. This event can be anything. The most common examples include tossing a coin, rolling a die, or choosing a card. Each of these events has multiple possibilities. Every such possibility is measured with the help of probability. To be more precise, the probability is used for calculating the occurrence of events that may or may not happen. Probability does not give sure results. Unless the probability of any event is 1, the different outcomes may or may not happen in real life, regardless of how less or how more their probability is.
Basic Probability
The simple definition of probability it is a chance of the occurrence of an event. It is defined in numerical form and the probability value is between 0 to 1. The probability value 0 indicates that there is no chance of that event occurring and the probability value 1 indicates that the event will occur. Sum of the probability value must be 1. The probability value is never a negative number. If it happens, then recheck the calculation.
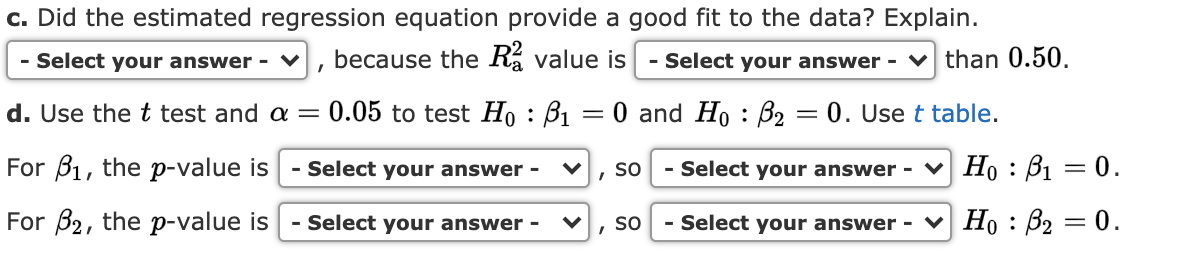
How do I find the p-value to each corresponding test statistic to complete the ANOVA table? I also need help with parts b-d.


Trending now
This is a popular solution!

Step by step
Solved in 2 steps


