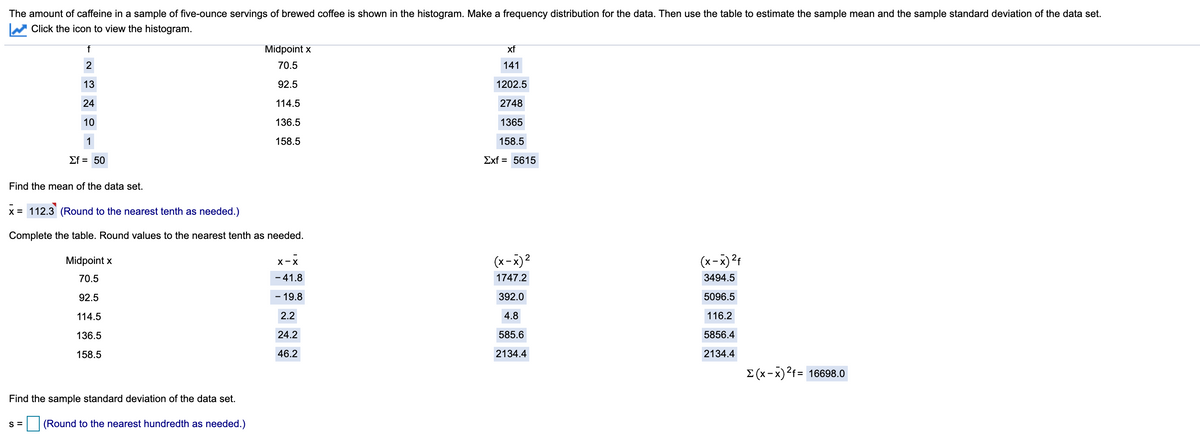
The amount of caffeine in a sample of five-ounce servings of brewed coffee is shown in the histogram. Make a frequency distribution for the data. Then use the table to estimate the sample mean and the sample standard deviation of the data set. W Click the icon to view the histogram. Midpoint x xf 2 70.5 141 13 92.5 1202.5 24 114.5 2748 10 136.5 1365 1 158.5 158.5 Ef = 50 Exf = 5615 Find the mean of the data set. . x= 112.3 (Round to the nearest tenth as needed.) Complete the table. Round values to the nearest tenth as needed. Midpoint x x-X (x-x)2 (x-x)?1 70.5 -41.8 1747.2 3494.5 92.5 - 19.8 392.0 5096.5 114.5 2.2 4.8 116.2 136.5 24.2 585.6 5856.4 158.5 46.2 2134.4 2134.4 E (x-x)21= 16698.0 Find the sample standard deviation of the data set. s=D (Round to the nearest hundredth as needed.)


Continuous Probability Distributions
Probability distributions are of two types, which are continuous probability distributions and discrete probability distributions. A continuous probability distribution contains an infinite number of values. For example, if time is infinite: you could count from 0 to a trillion seconds, billion seconds, so on indefinitely. A discrete probability distribution consists of only a countable set of possible values.
Normal Distribution
Suppose we had to design a bathroom weighing scale, how would we decide what should be the range of the weighing machine? Would we take the highest recorded human weight in history and use that as the upper limit for our weighing scale? This may not be a great idea as the sensitivity of the scale would get reduced if the range is too large. At the same time, if we keep the upper limit too low, it may not be usable for a large percentage of the population!


Trending now
This is a popular solution!

Step by step
Solved in 2 steps


