The amount of time adults spend watching television is closely monitored by firms because this helps to determine advertising pricing for commercials. Complete parts (a) through (d). (a) Do you think the variable "weekly time spent watching television" would be normally distributed? If not, what shape would you expect the variable to have? O A. The variable "weekly time spent watching television" is likely symmetric, but not normally distributed. O B. The variable "weekly time spent watching television" is likely uniform, not normally distributed. OC. The variable "weekly time spent watching television" is likely skewed right, not normally distributed. O D. The variable "weekly time spent watching television" is likely normally distributed. O E. The variable "weekly time spent watching television" is likely skewed left, not normally distributed. (b) According to a certain survey, adults spend 2.25 hours per day watching television on a weekday. Assume that the standard deviation for "time spent watching television on a weekday" is 1.93 hours. If a random sample of 40 adults is obtained, describe the sampling distribution of x, the mean amount of time spent watching television on a weekday. V with H =and o; = 3D (Round to six decimal places as needed.) (c) Determine the probability that a random sample of 40 adults results in a mean time watching television on a weekday of between 2 and 3 hours. The probability is . (Round to four decimal places as needed.)
The amount of time adults spend watching television is closely monitored by firms because this helps to determine advertising pricing for commercials. Complete parts (a) through (d). (a) Do you think the variable "weekly time spent watching television" would be normally distributed? If not, what shape would you expect the variable to have? O A. The variable "weekly time spent watching television" is likely symmetric, but not normally distributed. O B. The variable "weekly time spent watching television" is likely uniform, not normally distributed. OC. The variable "weekly time spent watching television" is likely skewed right, not normally distributed. O D. The variable "weekly time spent watching television" is likely normally distributed. O E. The variable "weekly time spent watching television" is likely skewed left, not normally distributed. (b) According to a certain survey, adults spend 2.25 hours per day watching television on a weekday. Assume that the standard deviation for "time spent watching television on a weekday" is 1.93 hours. If a random sample of 40 adults is obtained, describe the sampling distribution of x, the mean amount of time spent watching television on a weekday. V with H =and o; = 3D (Round to six decimal places as needed.) (c) Determine the probability that a random sample of 40 adults results in a mean time watching television on a weekday of between 2 and 3 hours. The probability is . (Round to four decimal places as needed.)

Algebra & Trigonometry with Analytic Geometry
13th Edition
ISBN:9781133382119
Author:Swokowski
Publisher:Swokowski
Chapter7: Analytic Trigonometry
Section7.6: The Inverse Trigonometric Functions
Problem 94E

Related questions
Question
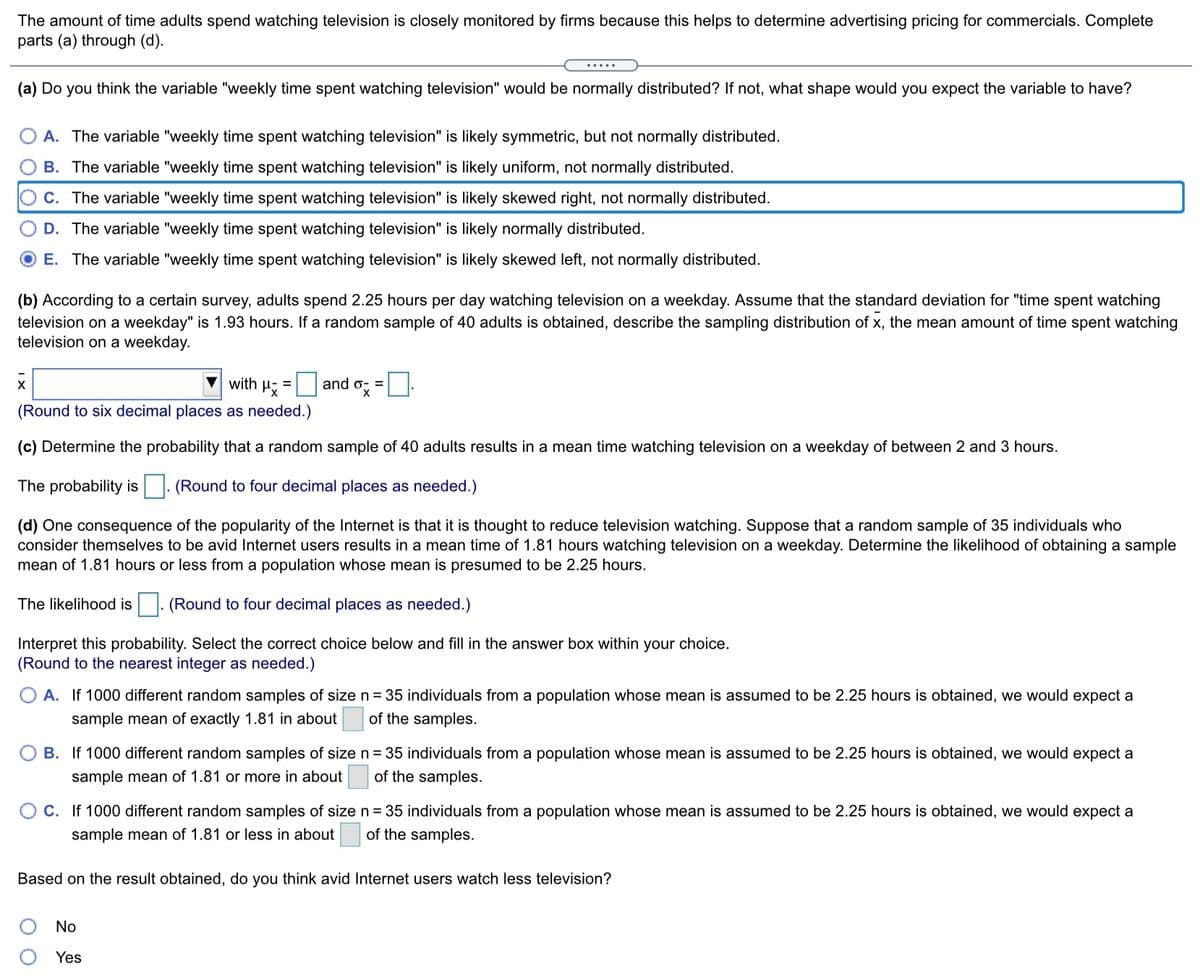
Transcribed Image Text:The amount of time adults spend watching television is closely monitored by firms because this helps to determine advertising pricing for commercials. Complete
parts (a) through (d).
.....
(a) Do you think the variable "weekly time spent watching television" would be normally distributed? If not, what shape would you expect the variable to have?
A. The variable "weekly time spent watching television" is likely symmetric, but not normally distributed.
B. The variable "weekly time spent watching television" is likely uniform, not normally distributed.
C. The variable "weekly time spent watching television" is likely skewed right, not normally distributed.
D. The variable "weekly time spent watching television" is likely normally distributed.
E. The variable "weekly time spent watching television" is likely skewed left, not normally distributed.
(b) According to a certain survey, adults spend 2.25 hours per day watching television on a weekday. Assume that the standard deviation for "time spent watching
television on a weekday" is 1.93 hours. If a random sample of 40 adults is obtained, describe the sampling distribution of x, the mean amount of time spent watching
television on a weekday.
V with
and ox
0- =
%3D
(Round to six decimal places as needed.)
(c) Determine the probability that a random sample of 40 adults results in a mean time watching television on a weekday of between 2 and 3 hours.
The probability is|. (Round to four decimal places as needed.)
(d) One consequence of the popularity of the Internet is that it is thought to reduce television watching. Suppose that a random sample of 35 individuals who
consider themselves to be avid Internet users results in a mean time of 1.81 hours watching television on a weekday. Determine the likelihood of obtaining a sample
mean of 1.81 hours or less from a population whose mean is presumed to be 2.25 hours.
The likelihood is
(Round to four decimal places as needed.)
Interpret this probability. Select the correct choice below and fill in the answer box within your choice.
(Round to the nearest integer as needed.)
O A. If 1000 different random samples of size n = 35 individuals from a population whose mean is assumed to be 2.25 hours is obtained, we would expect a
sample mean of exactly 1.81 in about
of the samples.
B. If 1000 different random samples of size n = 35 individuals from a population whose mean is assumed to be 2.25 hours is obtained, we would expect a
sample mean of 1.81 or more in about
of the samples.
O C. If 1000 different random samples of size n = 35 individuals from a population whose mean is assumed to be 2.25 hours is obtained, we would expect a
sample mean of 1.81 or less in about
of the samples.
Based on the result obtained, do you think avid Internet users watch less television?
No
Yes
O O
Expert Solution
This question has been solved!
Explore an expertly crafted, step-by-step solution for a thorough understanding of key concepts.

This is a popular solution!

Trending now
This is a popular solution!

Step by step
Solved in 2 steps with 1 images

Recommended textbooks for you
Algebra & Trigonometry with Analytic Geometry
Algebra
ISBN:
9781133382119
Author:
Swokowski
Publisher:
Cengage

Glencoe Algebra 1, Student Edition, 9780079039897…
Algebra
ISBN:
9780079039897
Author:
Carter
Publisher:
McGraw Hill

Algebra & Trigonometry with Analytic Geometry
Algebra
ISBN:
9781133382119
Author:
Swokowski
Publisher:
Cengage
Glencoe Algebra 1, Student Edition, 9780079039897…
Algebra
ISBN:
9780079039897
Author:
Carter
Publisher:
McGraw Hill

Trigonometry (MindTap Course List)
Trigonometry
ISBN:
9781337278461
Author:
Ron Larson
Publisher:
Cengage Learning

Functions and Change: A Modeling Approach to Coll…
Algebra
ISBN:
9781337111348
Author:
Bruce Crauder, Benny Evans, Alan Noell
Publisher:
Cengage Learning

Holt Mcdougal Larson Pre-algebra: Student Edition…
Algebra
ISBN:
9780547587776
Author:
HOLT MCDOUGAL
Publisher:
HOLT MCDOUGAL