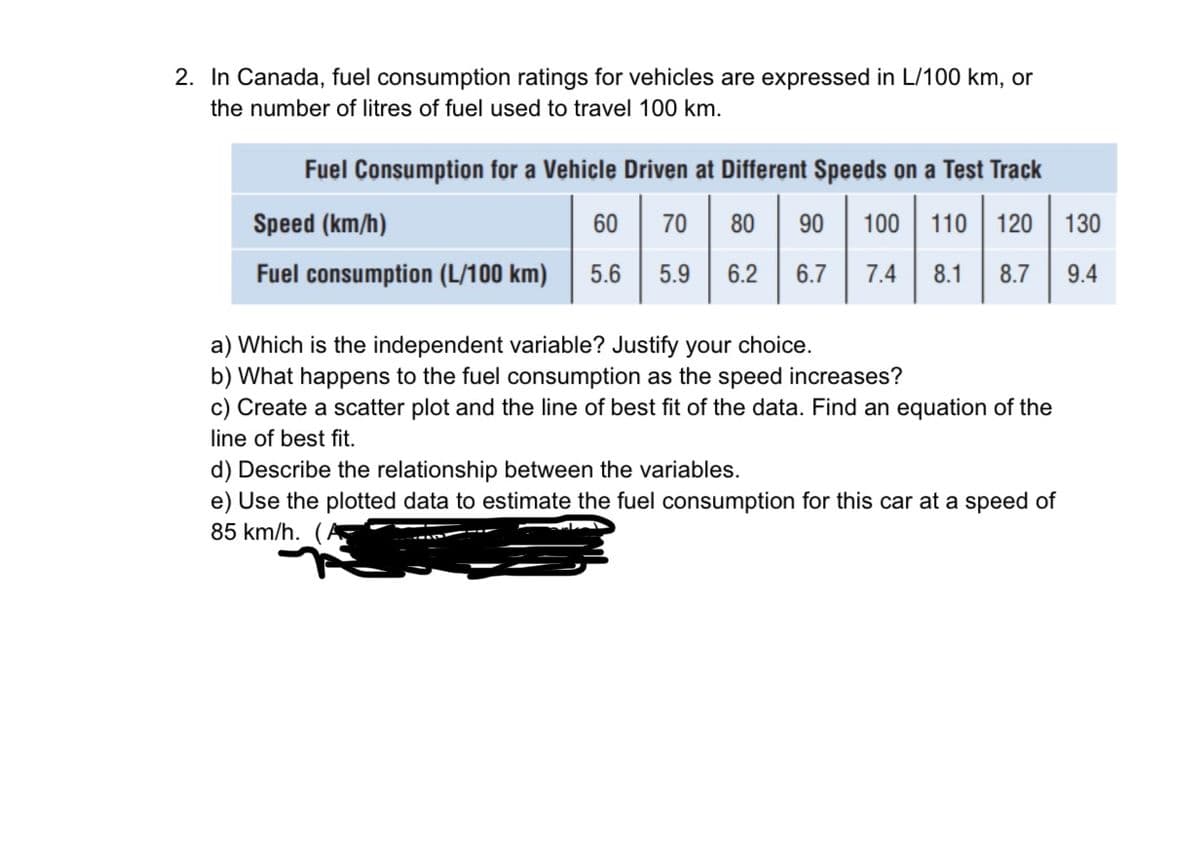
2. In Canada, fuel consumption ratings for vehicles are expressed in L/100 km, or the number of litres of fuel used to travel 100 km. Fuel Consumption for a Vehicle Driven at Different Speeds on a Test Track Speed (km/h) 60 70 80 90 100 110 120 130 Fuel consumption (L/100 km) 5.6 5.9 6.2 6.7 7.4 8.1 8.7 9.4 a) Which is the independent variable? Justify your choice. b) What happens to the fuel consumption as the speed increases? c) Create a scatter plot and the line of best fit of the data. Find an equation of the line of best fit. d) Describe the relationship between the variables. e) Use the plotted data to estimate the fuel consumption for this car at a speed of 85 km/h.
2. In Canada, fuel consumption ratings for vehicles are expressed in L/100 km, or the number of litres of fuel used to travel 100 km. Fuel Consumption for a Vehicle Driven at Different Speeds on a Test Track Speed (km/h) 60 70 80 90 100 110 120 130 Fuel consumption (L/100 km) 5.6 5.9 6.2 6.7 7.4 8.1 8.7 9.4 a) Which is the independent variable? Justify your choice. b) What happens to the fuel consumption as the speed increases? c) Create a scatter plot and the line of best fit of the data. Find an equation of the line of best fit. d) Describe the relationship between the variables. e) Use the plotted data to estimate the fuel consumption for this car at a speed of 85 km/h.

Glencoe Algebra 1, Student Edition, 9780079039897, 0079039898, 2018
18th Edition
ISBN:9780079039897
Author:Carter
Publisher:Carter
Chapter4: Equations Of Linear Functions
Section4.5: Correlation And Causation
Problem 22PFA

Related questions
Question
Transcribed Image Text:2. In Canada, fuel consumption ratings for vehicles are expressed in L/100 km, or
the number of litres of fuel used to travel 100 km.
Fuel Consumption for a Vehicle Driven at Different Speeds on a Test Track
Speed (km/h)
60
70
80
90
100
110
120
130
Fuel consumption (L/100 km)
5.6
5.9
6.2
6.7
7.4
8.1
8.7
9.4
a) Which is the independent variable? Justify your choice.
b) What happens to the fuel consumption as the speed increases?
c) Create a scatter plot and the line of best fit of the data. Find an equation of the
line of best fit.
d) Describe the relationship between the variables.
e) Use the plotted data to estimate the fuel consumption for this car at a speed of
85 km/h. (A
Expert Solution
This question has been solved!
Explore an expertly crafted, step-by-step solution for a thorough understanding of key concepts.

Step by step
Solved in 2 steps with 3 images

Recommended textbooks for you
Glencoe Algebra 1, Student Edition, 9780079039897…
Algebra
ISBN:
9780079039897
Author:
Carter
Publisher:
McGraw Hill

Big Ideas Math A Bridge To Success Algebra 1: Stu…
Algebra
ISBN:
9781680331141
Author:
HOUGHTON MIFFLIN HARCOURT
Publisher:
Houghton Mifflin Harcourt

Glencoe Algebra 1, Student Edition, 9780079039897…
Algebra
ISBN:
9780079039897
Author:
Carter
Publisher:
McGraw Hill
Big Ideas Math A Bridge To Success Algebra 1: Stu…
Algebra
ISBN:
9781680331141
Author:
HOUGHTON MIFFLIN HARCOURT
Publisher:
Houghton Mifflin Harcourt

Algebra & Trigonometry with Analytic Geometry
Algebra
ISBN:
9781133382119
Author:
Swokowski
Publisher:
Cengage