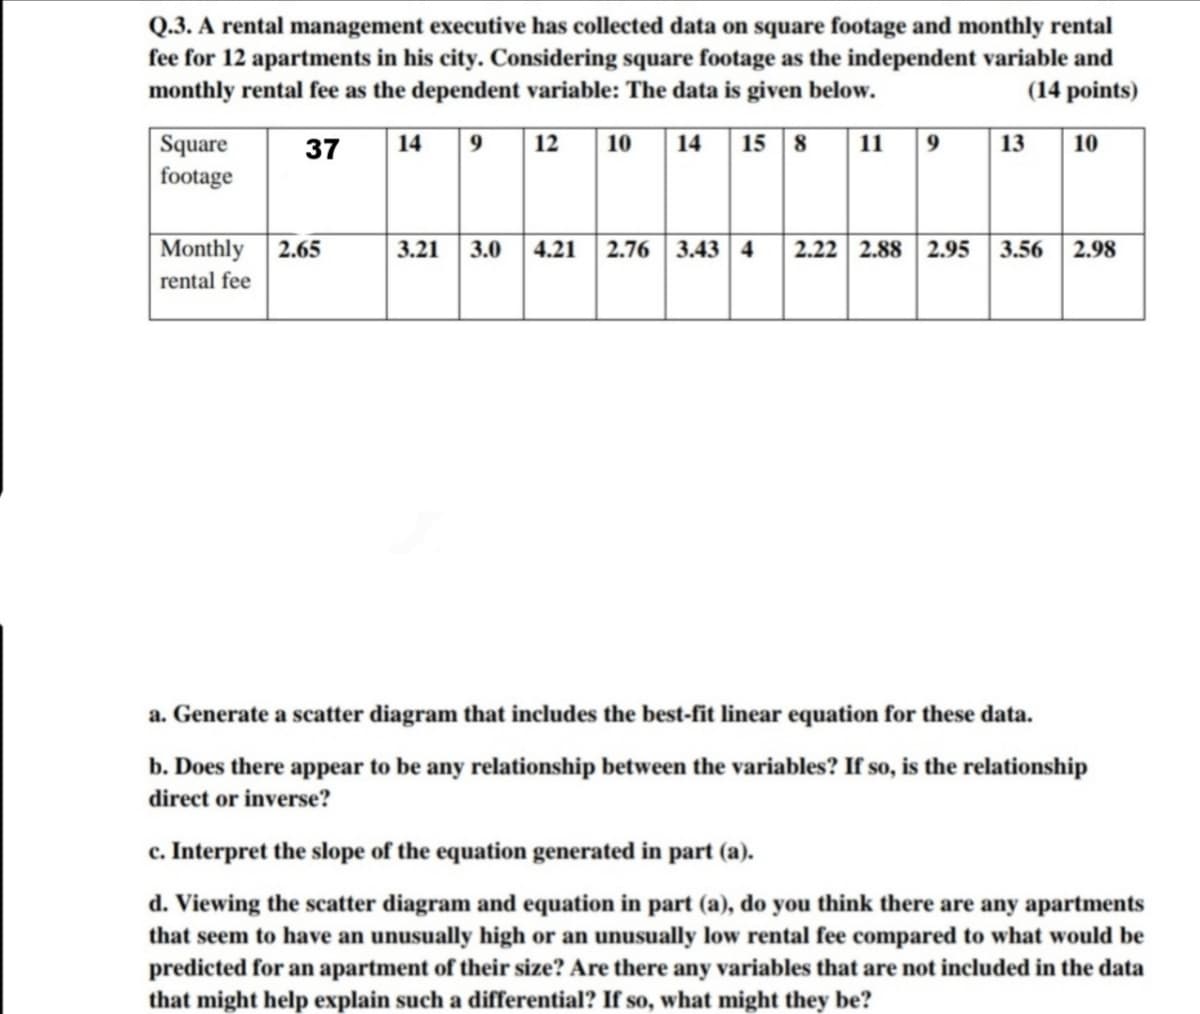
Q.3. A rental management executive has collected data on square footage and monthly rental fee for 12 apartments in his city. Considering square footage as the independent variable and monthly rental fee as the dependent variable: The data is given below. (14 points) Square footage 37 14 9 12 10 14 15 8 11 9 13 10 Monthly 2.65 3.21 3.0 4.21 2.76 3.43 4 2.22 2.88 2.95 3.56 2.98 rental fee

Glencoe Algebra 1, Student Edition, 9780079039897, 0079039898, 2018
18th Edition
ISBN:9780079039897
Author:Carter
Publisher:Carter
Chapter4: Equations Of Linear Functions
Section4.5: Correlation And Causation
Problem 11PPS
icon
Related questions
icon
Concept explainers
Question
Q.3. A rental management executive has collected data on square footage and monthly rental
fee for 12 apartments in his city. Considering square footage as the independent variable and
monthly rental fee as the dependent variable: The data is given below.
(14 points)
Square
footage
37
14
9
12
10
14
15 8
11
13
10
|Monthly
2.65
3.21
3.0
| 4.21 2.76 3.43 4
2.22 2.88 2.95
3.56
2.98
rental fee
a. Generate a scatter diagram that includes the best-fit linear equation for these data.
b. Does there appear to be any relationship between the variables? If so, is the relationship
direct or inverse?
c. Interpret the slope of the equation generated in part (a).
d. Viewing the scatter diagram and equation in part (a), do you think there are any apartments
that seem to have an unusually high or an unusually low rental fee compared to what would be
predicted for an apartment of their size? Are there any variables that are not included in the data
that might help explain such a differential? If so, what might they be?
Transcribed Image Text:Q.3. A rental management executive has collected data on square footage and monthly rental fee for 12 apartments in his city. Considering square footage as the independent variable and monthly rental fee as the dependent variable: The data is given below. (14 points) Square footage 37 14 9 12 10 14 15 8 11 13 10 |Monthly 2.65 3.21 3.0 | 4.21 2.76 3.43 4 2.22 2.88 2.95 3.56 2.98 rental fee a. Generate a scatter diagram that includes the best-fit linear equation for these data. b. Does there appear to be any relationship between the variables? If so, is the relationship direct or inverse? c. Interpret the slope of the equation generated in part (a). d. Viewing the scatter diagram and equation in part (a), do you think there are any apartments that seem to have an unusually high or an unusually low rental fee compared to what would be predicted for an apartment of their size? Are there any variables that are not included in the data that might help explain such a differential? If so, what might they be?
Expert Solution
trending now

Trending now

This is a popular solution!

steps

Step by step

Solved in 2 steps with 3 images

Blurred answer
Knowledge Booster
Correlation, Regression, and Association
Learn more about
Need a deep-dive on the concept behind this application? Look no further. Learn more about this topic, statistics and related others by exploring similar questions and additional content below.
Recommended textbooks for you
Glencoe Algebra 1, Student Edition, 9780079039897…
Algebra
ISBN:
9780079039897
Author:
Carter
Publisher:
McGraw Hill