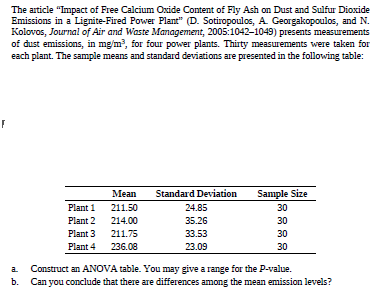
The article "Impact of Free Calcium Oxide Content of Fly Ash on Dust and Sulfur Dioxide Emissions in a Lignite-Fired Power Plant" (D. Sotiropoulos, A. Georgakopoulos, and N. Kolovos, Journal of Air and Waste Management, 2005:1042-1049) presents measurements of dust emissions, in mg/m?, for four power plants. Thirty measurements were taken for each plant. The sample means and standard deviations are presented in the following table: Mean Standard Deviation Sample Size Plant 1 211.50 24.85 30 Plant 2 214.00 35.26 30 Plant 3 211.75 33.53 30 Plant 4 236.08 23.09 30 Construct an ANOVA table. You may give a range for the P-value. Can you conclude that there are differences among the mean emission levels? a. b.
The article "Impact of Free Calcium Oxide Content of Fly Ash on Dust and Sulfur Dioxide Emissions in a Lignite-Fired Power Plant" (D. Sotiropoulos, A. Georgakopoulos, and N. Kolovos, Journal of Air and Waste Management, 2005:1042-1049) presents measurements of dust emissions, in mg/m?, for four power plants. Thirty measurements were taken for each plant. The sample means and standard deviations are presented in the following table: Mean Standard Deviation Sample Size Plant 1 211.50 24.85 30 Plant 2 214.00 35.26 30 Plant 3 211.75 33.53 30 Plant 4 236.08 23.09 30 Construct an ANOVA table. You may give a range for the P-value. Can you conclude that there are differences among the mean emission levels? a. b.

MATLAB: An Introduction with Applications
6th Edition
ISBN:9781119256830
Author:Amos Gilat
Publisher:Amos Gilat
Chapter1: Starting With Matlab
Section: Chapter Questions
Problem 1P

Related questions
Question
Transcribed Image Text:The article "Impact of Free Calcium Oxide Content of Fly Ash on Dust and Sulfur Dioxide
Emissions in a Lignite-Fired Power Plant" (D. Sotiropoulos, A. Georgakopoulos, and N.
Kolovos, Journal of Air and Waste Management, 2005:1042-1049) presents measurements
of dust emissions, in mg/m?, for four power plants. Thirty measurements were taken for
each plant. The sample means and standard deviations are presented in the following table:
Mean
Standard Deviation
Sample Size
Plant 1
211.50
24.85
30
Plant 2 214.00
35.26
30
Plant 3
211.75
33.53
30
Plant 4 236.08
23.09
30
Construct an ANOVA table. You may give a range for the P-value.
Can you conclude that there are differences among the mean emission levels?
a.
b.
Expert Solution
This question has been solved!
Explore an expertly crafted, step-by-step solution for a thorough understanding of key concepts.

This is a popular solution!

Trending now
This is a popular solution!

Step by step
Solved in 3 steps with 5 images

Recommended textbooks for you
MATLAB: An Introduction with Applications
Statistics
ISBN:
9781119256830
Author:
Amos Gilat
Publisher:
John Wiley & Sons Inc

Probability and Statistics for Engineering and th…
Statistics
ISBN:
9781305251809
Author:
Jay L. Devore
Publisher:
Cengage Learning

Statistics for The Behavioral Sciences (MindTap C…
Statistics
ISBN:
9781305504912
Author:
Frederick J Gravetter, Larry B. Wallnau
Publisher:
Cengage Learning
MATLAB: An Introduction with Applications
Statistics
ISBN:
9781119256830
Author:
Amos Gilat
Publisher:
John Wiley & Sons Inc
Probability and Statistics for Engineering and th…
Statistics
ISBN:
9781305251809
Author:
Jay L. Devore
Publisher:
Cengage Learning
Statistics for The Behavioral Sciences (MindTap C…
Statistics
ISBN:
9781305504912
Author:
Frederick J Gravetter, Larry B. Wallnau
Publisher:
Cengage Learning

Elementary Statistics: Picturing the World (7th E…
Statistics
ISBN:
9780134683416
Author:
Ron Larson, Betsy Farber
Publisher:
PEARSON

The Basic Practice of Statistics
Statistics
ISBN:
9781319042578
Author:
David S. Moore, William I. Notz, Michael A. Fligner
Publisher:
W. H. Freeman

Introduction to the Practice of Statistics
Statistics
ISBN:
9781319013387
Author:
David S. Moore, George P. McCabe, Bruce A. Craig
Publisher:
W. H. Freeman