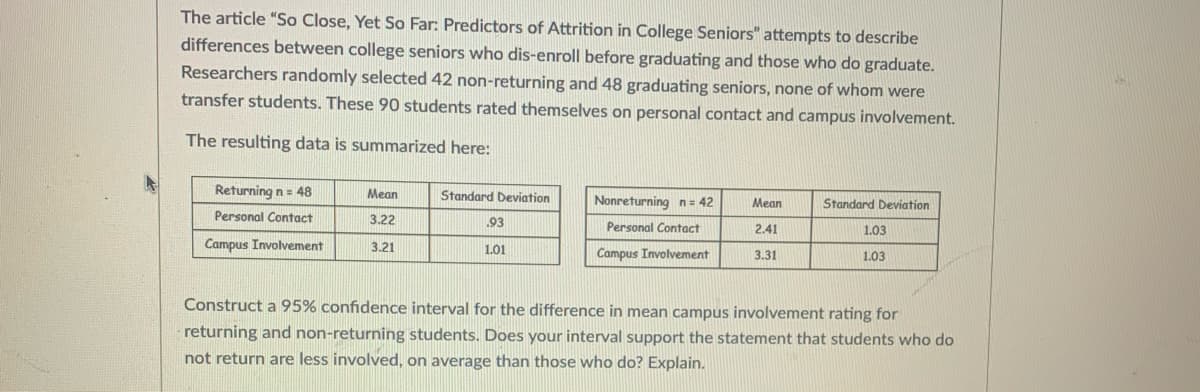
The article "So Close, Yet So Far: Predictors of Attrition in College Seniors" attempts to describe differences between college seniors who dis-enroll before graduating and those who do graduate. Researchers randomly selected 42 non-returning and 48 graduating seniors, none of whom were transfer students. These 90 students rated themselves on personal contact and campus involvement. The resulting data is summarized here: Returning n= 48 Mean Standard Deviation Nonreturning n= 42 Mean Standard Deviation Personal Contact 3.22 93 Personal Contact 2.41 1.03 Campus Involvement 3.21 1.01 Campus Involvement 3.31 1.03 Construct a 95% confidence interval for the difference in mean campus involvement rating for returning and non-returning students. Does your interval support the statement that students who do
The article "So Close, Yet So Far: Predictors of Attrition in College Seniors" attempts to describe differences between college seniors who dis-enroll before graduating and those who do graduate. Researchers randomly selected 42 non-returning and 48 graduating seniors, none of whom were transfer students. These 90 students rated themselves on personal contact and campus involvement. The resulting data is summarized here: Returning n= 48 Mean Standard Deviation Nonreturning n= 42 Mean Standard Deviation Personal Contact 3.22 93 Personal Contact 2.41 1.03 Campus Involvement 3.21 1.01 Campus Involvement 3.31 1.03 Construct a 95% confidence interval for the difference in mean campus involvement rating for returning and non-returning students. Does your interval support the statement that students who do

Glencoe Algebra 1, Student Edition, 9780079039897, 0079039898, 2018
18th Edition
ISBN:9780079039897
Author:Carter
Publisher:Carter
Chapter10: Statistics
Section10.4: Distributions Of Data
Problem 19PFA

Related questions
Topic Video
Question
Transcribed Image Text:The article "So Close, Yet So Far: Predictors of Attrition in College Seniors" attempts to describe
differences between college seniors who dis-enroll before graduating and those who do graduate.
Researchers randomly selected 42 non-returning and 48 graduating seniors, none of whom were
transfer students. These 90 students rated themselves on personal contact and campus involvement.
The resulting data is summarized here:
Returning n= 48
Mean
Standard Deviation
Nonreturning n = 42
Mean
Standard Deviation
Personal Contact
3.22
93
Personal Contact
2.41
1.03
Campus Involvement
3.21
1.01
Campus Involvement
3.31
1.03
Construct a 95% confidence interval for the difference in mean campus involvement rating for
returning and non-returning students. Does your interval support the statement that students who do
not return are less involved, on average than those who do? Explain.
Expert Solution
This question has been solved!
Explore an expertly crafted, step-by-step solution for a thorough understanding of key concepts.

This is a popular solution!

Trending now
This is a popular solution!

Step by step
Solved in 2 steps with 2 images

Knowledge Booster


Learn more about
Need a deep-dive on the concept behind this application? Look no further. Learn more about this topic, statistics and related others by exploring similar questions and additional content below.Recommended textbooks for you
Glencoe Algebra 1, Student Edition, 9780079039897…
Algebra
ISBN:
9780079039897
Author:
Carter
Publisher:
McGraw Hill
Glencoe Algebra 1, Student Edition, 9780079039897…
Algebra
ISBN:
9780079039897
Author:
Carter
Publisher:
McGraw Hill