The average American gets a haircut every 39 days. Is the average smaller for college students? The data below shows the results of a survey of 12 college students asking them how many days elapse between haircuts. Assume that the distribution of the population is normal. 39, 41, 39, 31, 44, 36, 29, 42, 45, 32, 41, 33 What can be concluded at the the a = 0.10 level of significance level of significance? a. For this study, we should use t-test for a population mean b. The null and alternative hypotheses would be: Họ: %3D H1: v Select an answer v c. The test statistic ? (please show your answer to 3 decimal places.) %3D d. The p-value = (Please show your answer to 3 decimal places.) e. The p-value is ? va f. Based on this, we should Select an answer v the null hypothesis. g. Thus, the final conclusion is that... O The data suggest the populaton mean is significantly lower than 39 at a = 0.10, so there is sufficient evidence to conclude that the population mean number of days between haircuts for college students is lower than 39. O The data suggest the population mean number of days between haircuts for college students is not significantly lower than 39 at a = 0.10, so there is insufficient evidence to conclude that the population mean number of days between haircuts for college students is lower than 39. O The data suggest the population mean is not significantly lower than 39 at a = 0.10, so there is sufficient evidence to conclude that the population mean number of days between haircuts for college students is equal to 39.
The average American gets a haircut every 39 days. Is the average smaller for college students? The data below shows the results of a survey of 12 college students asking them how many days elapse between haircuts. Assume that the distribution of the population is normal. 39, 41, 39, 31, 44, 36, 29, 42, 45, 32, 41, 33 What can be concluded at the the a = 0.10 level of significance level of significance? a. For this study, we should use t-test for a population mean b. The null and alternative hypotheses would be: Họ: %3D H1: v Select an answer v c. The test statistic ? (please show your answer to 3 decimal places.) %3D d. The p-value = (Please show your answer to 3 decimal places.) e. The p-value is ? va f. Based on this, we should Select an answer v the null hypothesis. g. Thus, the final conclusion is that... O The data suggest the populaton mean is significantly lower than 39 at a = 0.10, so there is sufficient evidence to conclude that the population mean number of days between haircuts for college students is lower than 39. O The data suggest the population mean number of days between haircuts for college students is not significantly lower than 39 at a = 0.10, so there is insufficient evidence to conclude that the population mean number of days between haircuts for college students is lower than 39. O The data suggest the population mean is not significantly lower than 39 at a = 0.10, so there is sufficient evidence to conclude that the population mean number of days between haircuts for college students is equal to 39.

Glencoe Algebra 1, Student Edition, 9780079039897, 0079039898, 2018
18th Edition
ISBN:9780079039897
Author:Carter
Publisher:Carter
Chapter10: Statistics
Section10.4: Distributions Of Data
Problem 19PFA

Related questions
Topic Video
Question
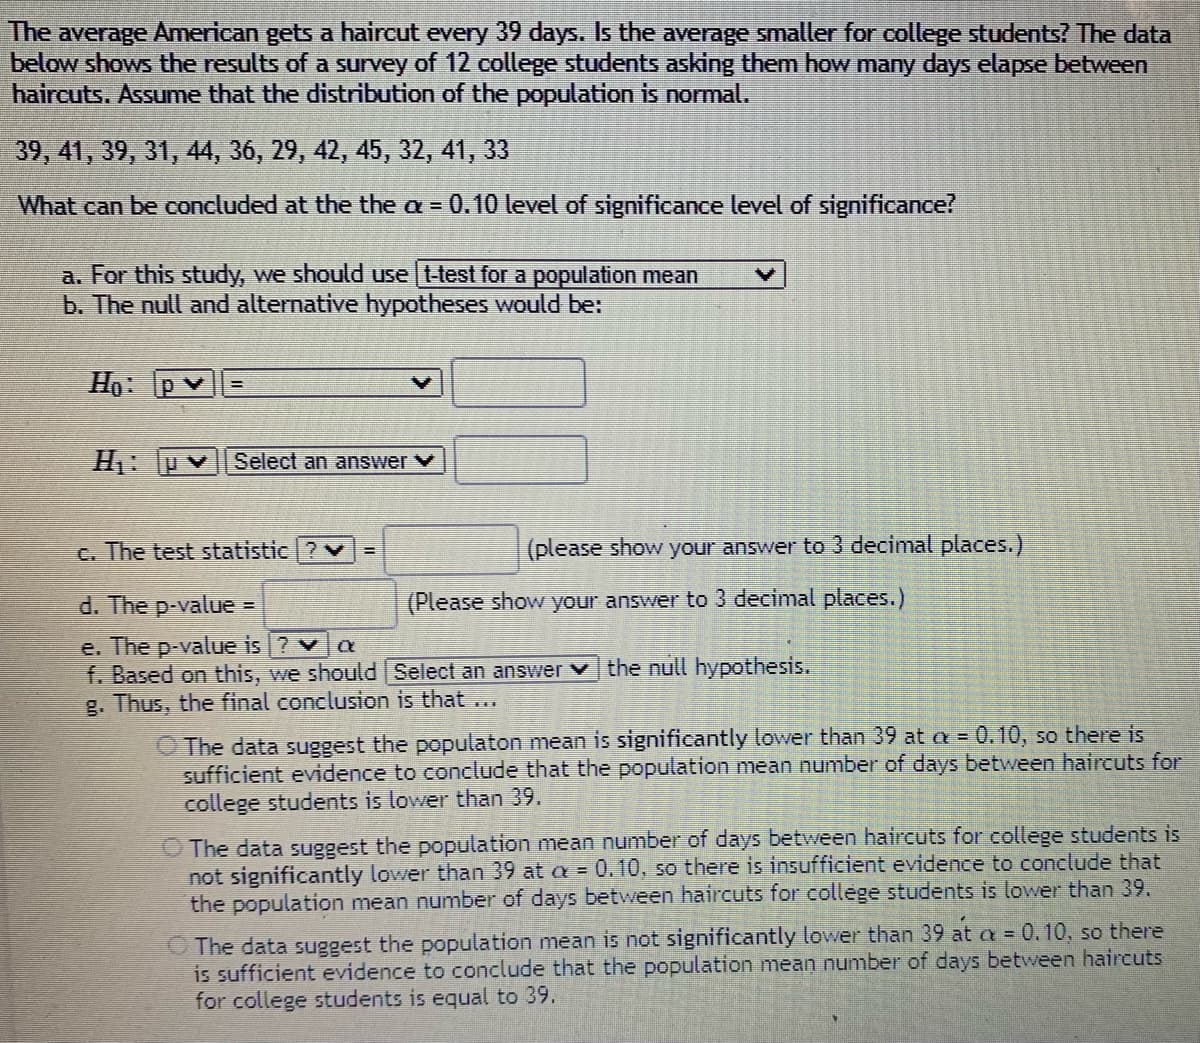
Transcribed Image Text:The average American gets a haircut every 39 days. Is the average smaller for college students? The data
below shows the results of a survey of 12 college students asking them how many days elapse between
haircuts. Assume that the distribution of the population is normal.
39, 41, 39, 31, 44, 36, 29, 42, 45, 32, 41, 33
What can be concluded at the the a = 0.10 level of significance level of significance?
a. For this study, we should use t-test for a population mean
b. The null and alternative hypotheses would be:
Ho: P
U V
Select an answer V
c. The test statistic
(please show your answer to 3 decimal places.)
d. The p-value =
(Please show your answer to 3 decimal places.)
e. The p-value is ? va
f. Based on this, we should Select an answer
g. Thus, the final conclusion is that
the null hypothesis.
O The data suggest the populaton mean is significantly lower than 39 at a = 0.10, so there is
sufficient evidence to conclude that the population mean number of days between haircuts for
college students is lower than 39.
O The data suggest the population mean number of days between haircuts for college students is
not significantly lower than 39 at a = 0.10, so there is insufficient evidence to conclude that
the population mean number of days between haircuts for college students is lower than 39.
O The data suggest the population mean is not significantly lower than 39 at a = 0.10, so there
is sufficient evidence to conclude that the population mean number of days between haircuts
for college students is equal to 39.
Expert Solution
This question has been solved!
Explore an expertly crafted, step-by-step solution for a thorough understanding of key concepts.

This is a popular solution!

Trending now
This is a popular solution!

Step by step
Solved in 4 steps with 1 images

Knowledge Booster


Learn more about
Need a deep-dive on the concept behind this application? Look no further. Learn more about this topic, statistics and related others by exploring similar questions and additional content below.Recommended textbooks for you
Glencoe Algebra 1, Student Edition, 9780079039897…
Algebra
ISBN:
9780079039897
Author:
Carter
Publisher:
McGraw Hill

College Algebra (MindTap Course List)
Algebra
ISBN:
9781305652231
Author:
R. David Gustafson, Jeff Hughes
Publisher:
Cengage Learning
Glencoe Algebra 1, Student Edition, 9780079039897…
Algebra
ISBN:
9780079039897
Author:
Carter
Publisher:
McGraw Hill
College Algebra (MindTap Course List)
Algebra
ISBN:
9781305652231
Author:
R. David Gustafson, Jeff Hughes
Publisher:
Cengage Learning