The average daily volume of a computer stock in 2011 was u= 35.1 million shares, according to a reliable source. A stock analyst believes that the stock volume in 2018 is different from the 2011 level. Based on a random sample of 30 trading days in 2018, he finds the sample mean to be 27.1 million shares, with a standard deviation of s = 13.3 million shares. Test the hypotheses by constructing a 95% confidence interval. Complete parts (a) through (c) below. (a) State the hypotheses for the test. Họ: H 35.1 million shares H4: * 35.1 million shares (b) Construct a 95% confidence interval about the sample mean of stocks traded in 2018. With 95% confidence, the mean stock volume in 2018 between 22.134 million shares and 32.066 million shares. (Round to three decimal places as needed.) (c) Will the researcher reject the null hypothesis? O A. Reject the null hypothesis because u= 35.1 million shares does not fall in the confidence interval. O B. Do not reject the null hypothesis because u= 35.1 million shares falls in the confidence interval. OC. Do not reject the null hypothesis because u= 35.1 million shares does not fall in the confidence interval. O D. Reject the null hypothesis because u= 35.1 million shares falls in the confidence interval.
The average daily volume of a computer stock in 2011 was u= 35.1 million shares, according to a reliable source. A stock analyst believes that the stock volume in 2018 is different from the 2011 level. Based on a random sample of 30 trading days in 2018, he finds the sample mean to be 27.1 million shares, with a standard deviation of s = 13.3 million shares. Test the hypotheses by constructing a 95% confidence interval. Complete parts (a) through (c) below. (a) State the hypotheses for the test. Họ: H 35.1 million shares H4: * 35.1 million shares (b) Construct a 95% confidence interval about the sample mean of stocks traded in 2018. With 95% confidence, the mean stock volume in 2018 between 22.134 million shares and 32.066 million shares. (Round to three decimal places as needed.) (c) Will the researcher reject the null hypothesis? O A. Reject the null hypothesis because u= 35.1 million shares does not fall in the confidence interval. O B. Do not reject the null hypothesis because u= 35.1 million shares falls in the confidence interval. OC. Do not reject the null hypothesis because u= 35.1 million shares does not fall in the confidence interval. O D. Reject the null hypothesis because u= 35.1 million shares falls in the confidence interval.

MATLAB: An Introduction with Applications
6th Edition
ISBN:9781119256830
Author:Amos Gilat
Publisher:Amos Gilat
Chapter1: Starting With Matlab
Section: Chapter Questions
Problem 1P

Related questions
Question
Question 9
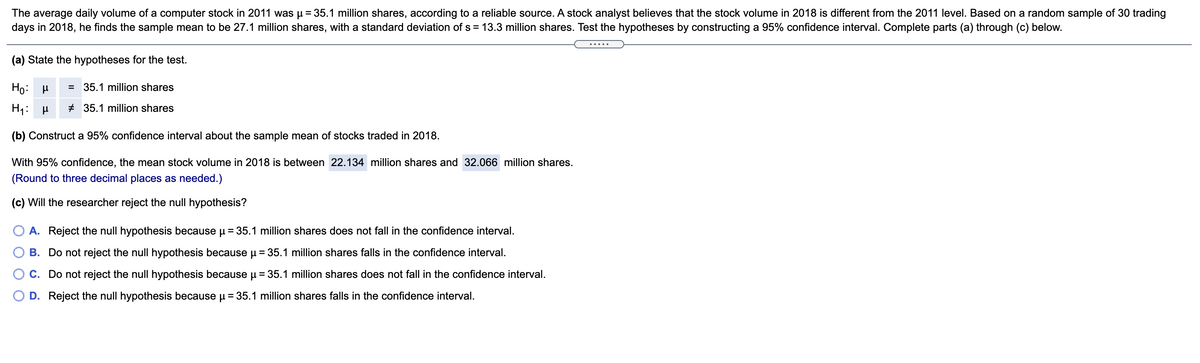
Transcribed Image Text:The average daily volume of a computer stock in 2011 was µ = 35.1 million shares, according to a reliable source. A stock analyst believes that the stock volume in 2018 is different from the 2011 level. Based on a random sample of 30 trading
days in 2018, he finds the sample mean to be 27.1 million shares, with a standard deviation of s = 13.3 million shares. Test the hypotheses by constructing a 95% confidence interval. Complete parts (a) through (c) below.
.....
(a) State the hypotheses for the test.
Ho: H
= 35.1 million shares
+ 35.1 million shares
(b) Construct a 95% confidence interval about the sample mean of stocks traded in 2018.
With 95% confidence, the mean stock volume in 2018 is between 22.134 million shares and 32.066 million shares.
(Round to three decimal places as needed.)
(c) Will the researcher reject the null hypothesis?
O A. Reject the null hypothesis because u = 35.1 million shares does not fall in the confidence interval.
B. Do not reject the null hypothesis because u = 35.1 million shares falls in the confidence interval.
C. Do not reject the null hypothesis because µ = 35.1 million shares does not fall in the confidence interval.
D. Reject the null hypothesis because u = 35.1 million shares falls in the confidence interval.
Expert Solution
This question has been solved!
Explore an expertly crafted, step-by-step solution for a thorough understanding of key concepts.

This is a popular solution!

Trending now
This is a popular solution!

Step by step
Solved in 2 steps

Recommended textbooks for you
MATLAB: An Introduction with Applications
Statistics
ISBN:
9781119256830
Author:
Amos Gilat
Publisher:
John Wiley & Sons Inc

Probability and Statistics for Engineering and th…
Statistics
ISBN:
9781305251809
Author:
Jay L. Devore
Publisher:
Cengage Learning

Statistics for The Behavioral Sciences (MindTap C…
Statistics
ISBN:
9781305504912
Author:
Frederick J Gravetter, Larry B. Wallnau
Publisher:
Cengage Learning
MATLAB: An Introduction with Applications
Statistics
ISBN:
9781119256830
Author:
Amos Gilat
Publisher:
John Wiley & Sons Inc
Probability and Statistics for Engineering and th…
Statistics
ISBN:
9781305251809
Author:
Jay L. Devore
Publisher:
Cengage Learning
Statistics for The Behavioral Sciences (MindTap C…
Statistics
ISBN:
9781305504912
Author:
Frederick J Gravetter, Larry B. Wallnau
Publisher:
Cengage Learning

Elementary Statistics: Picturing the World (7th E…
Statistics
ISBN:
9780134683416
Author:
Ron Larson, Betsy Farber
Publisher:
PEARSON

The Basic Practice of Statistics
Statistics
ISBN:
9781319042578
Author:
David S. Moore, William I. Notz, Michael A. Fligner
Publisher:
W. H. Freeman

Introduction to the Practice of Statistics
Statistics
ISBN:
9781319013387
Author:
David S. Moore, George P. McCabe, Bruce A. Craig
Publisher:
W. H. Freeman