The average numbers of days it took a city's department to respond to requests to fix potholes are described by the density histogram to the right for each of the weeks in 2012 and 2013. Complete parts (a) through (e) below. Average Response Time to Fix Potholes 0.067 0.05- 0.04- 0.03- 0.38 0.02- 022. 0.01- 0.10 0.08 0.04 0.06 7 14 21 28 35 42 49 56 Days 0.000 63 70 77 ..... a. Identify the class that contains the 50th percentile, which is a measure of the center. Choose the correct answer below and fill in the answer box(es) to complete your choice. (Type a whole number.) O A. The class that contains the 50th percentile is days. O B. The class that contains the 50th percentile is to days. Are the observations in the class typical values? Explain. Choose the correct answer below. O A. Yes, because the percentage of observations in this class is a lot more than the majority of the other classes. O B. Yes, because this class contains the greatest number of observations. O C. No, because the values in each class are not related. O D. No, because the percentage of observations in this class is a lot less than the majority of the other classes. b. For what proportion of the weeks was the average response time at least 28 days? Note that some of the bars in the density histogram were left blank on purpose. The proportion of weeks with an average response time of at least 28 days was (Type an integer or a decimal. Do not round.) c. From inspecting the histogram, a student concludes that in 2015, the average response time will be less than 21 days for 70% of the weeks. What would you tell the student? O A The distribution in 2015 will be the same as in 2012 and 2013, but this is not the correct response time for 2012 and 2013. O B. The distribution in 2015 will always be different from the one in 2012 and 2013. OC. It cannot be assumed that the distribution in 2015 will be the same as in 2012 and 2013. O D. The distribution in 2015 will be the same as in 2012 and 2013, so this is correct. d. The department has a target that the average time to respond to pothole requests made in a given week be at most 7 days. Estimate the percentile of the observation 7 days. The estimate for the percentile of the observation 7 days is the th percentile. (Type an integer or a decimal.)
The average numbers of days it took a city's department to respond to requests to fix potholes are described by the density histogram to the right for each of the weeks in 2012 and 2013. Complete parts (a) through (e) below. Average Response Time to Fix Potholes 0.067 0.05- 0.04- 0.03- 0.38 0.02- 022. 0.01- 0.10 0.08 0.04 0.06 7 14 21 28 35 42 49 56 Days 0.000 63 70 77 ..... a. Identify the class that contains the 50th percentile, which is a measure of the center. Choose the correct answer below and fill in the answer box(es) to complete your choice. (Type a whole number.) O A. The class that contains the 50th percentile is days. O B. The class that contains the 50th percentile is to days. Are the observations in the class typical values? Explain. Choose the correct answer below. O A. Yes, because the percentage of observations in this class is a lot more than the majority of the other classes. O B. Yes, because this class contains the greatest number of observations. O C. No, because the values in each class are not related. O D. No, because the percentage of observations in this class is a lot less than the majority of the other classes. b. For what proportion of the weeks was the average response time at least 28 days? Note that some of the bars in the density histogram were left blank on purpose. The proportion of weeks with an average response time of at least 28 days was (Type an integer or a decimal. Do not round.) c. From inspecting the histogram, a student concludes that in 2015, the average response time will be less than 21 days for 70% of the weeks. What would you tell the student? O A The distribution in 2015 will be the same as in 2012 and 2013, but this is not the correct response time for 2012 and 2013. O B. The distribution in 2015 will always be different from the one in 2012 and 2013. OC. It cannot be assumed that the distribution in 2015 will be the same as in 2012 and 2013. O D. The distribution in 2015 will be the same as in 2012 and 2013, so this is correct. d. The department has a target that the average time to respond to pothole requests made in a given week be at most 7 days. Estimate the percentile of the observation 7 days. The estimate for the percentile of the observation 7 days is the th percentile. (Type an integer or a decimal.)

Big Ideas Math A Bridge To Success Algebra 1: Student Edition 2015
1st Edition
ISBN:9781680331141
Author:HOUGHTON MIFFLIN HARCOURT
Publisher:HOUGHTON MIFFLIN HARCOURT
Chapter11: Data Analysis And Displays
Section: Chapter Questions
Problem 10CT

Related questions
Question
HELP PLEASE URGENT! Thank you :)
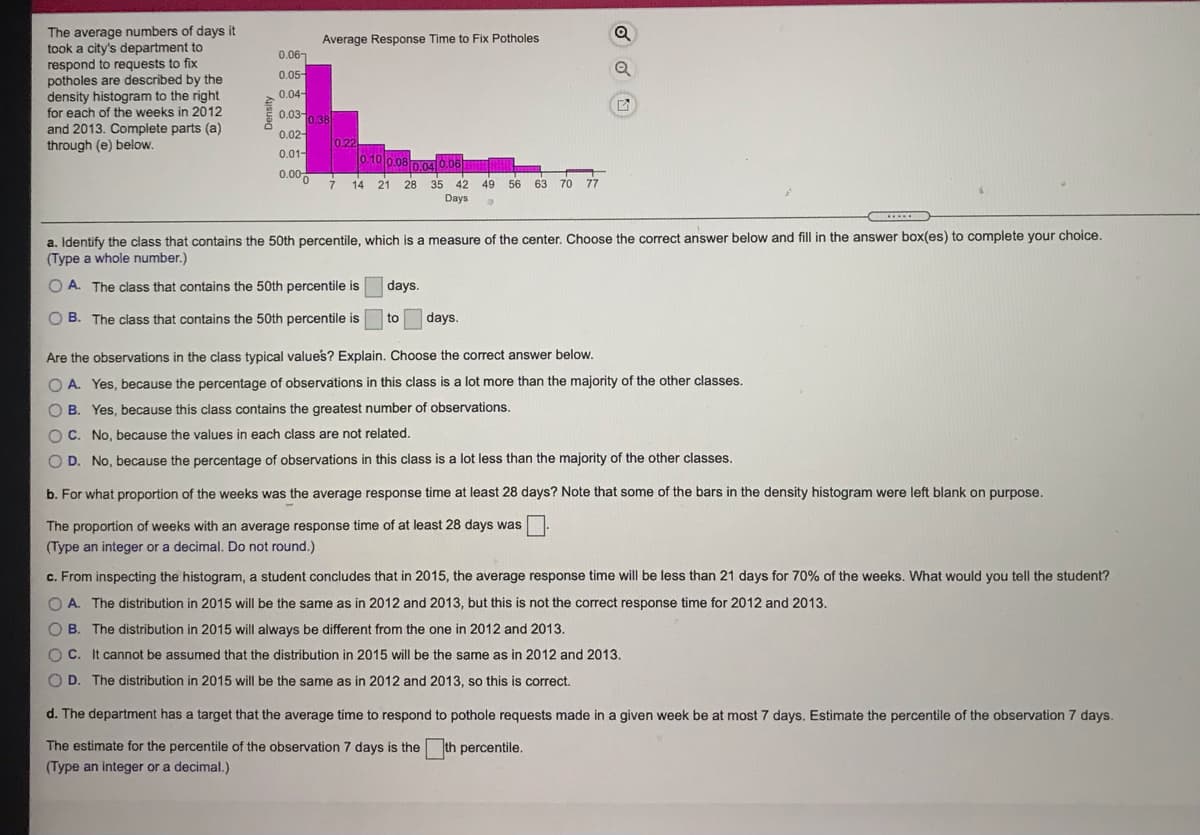
Transcribed Image Text:The average numbers of days it
took a city's department to
respond to requests to fix
potholes are described by the
density histogram to the right
for each of the weeks in 2012
Q
Average Response Time to Fix Potholes
0.067
0.05-
0.04-
0.030.38
and 2013. Complete parts (a)
through (e) below.
0.02-
0.22
0.10 0.080.04 0.06
0.01-
0.00
14
21 28 35
42
49
56 63 70 77
Days
a. Identify the class that contains the 50th percentile, which is a measure of the center. Choose the correct answer below and fill in the answer box(es) to complete your choice.
(Type a whole number.)
O A. The class that contains the 50th percentile is
days.
O B. The class that contains the 50th percentile is
to
days.
Are the observations in the class typical values? Explain. Choose the correct answer below.
O A. Yes, because the percentage of observations in this class is a lot more than the majority of the other classes.
OB.
Yes, because this class contains the greatest number of observations.
O C. No, because the values in each class are not related.
O D. No, because the percentage of observations in this class is a lot less than the majority of the other classes.
b. For what proportion of the weeks was the average response time at least 28 days? Note that some of the bars in the density histogram were left blank on purpose.
The proportion of weeks with an average response time of at least 28 days was
(Type an integer or a decimal. Do not round.)
c. From inspecting the histogram, a student concludes that in 2015, the average response time will be less than 21 days for 70% of the weeks. What would you tell the student?
O A. The distribution in 2015 will be the same as in 2012 and 2013, but this is not the correct response time for 2012 and 2013.
O B. The distribution in 2015 will always be different from the one in 2012 and 2013.
OC.
O C. It cannot be assumed that the distribution in 2015 will be the same as in 2012 and 2013.
O D. The distribution in 2015 will be the same as in 2012 and 2013, so this is correct.
d. The department has a target that the average time to respond to pothole requests made in a given week be at most 7 days. Estimate the percentile of the observation 7 days.
The estimate for the percentile of the observation 7 days is the th percentile.
(Type an integer or a decimal.)
Expert Solution
This question has been solved!
Explore an expertly crafted, step-by-step solution for a thorough understanding of key concepts.

This is a popular solution!

Trending now
This is a popular solution!

Step by step
Solved in 2 steps

Recommended textbooks for you
Big Ideas Math A Bridge To Success Algebra 1: Stu…
Algebra
ISBN:
9781680331141
Author:
HOUGHTON MIFFLIN HARCOURT
Publisher:
Houghton Mifflin Harcourt

Glencoe Algebra 1, Student Edition, 9780079039897…
Algebra
ISBN:
9780079039897
Author:
Carter
Publisher:
McGraw Hill
Big Ideas Math A Bridge To Success Algebra 1: Stu…
Algebra
ISBN:
9781680331141
Author:
HOUGHTON MIFFLIN HARCOURT
Publisher:
Houghton Mifflin Harcourt
Glencoe Algebra 1, Student Edition, 9780079039897…
Algebra
ISBN:
9780079039897
Author:
Carter
Publisher:
McGraw Hill