The average price of a gallon of gas in 2015 dropped $0.94 (28 percent) from $3.34 in 2014 (to $2.40 in 2015). Required: 1. Conduct a horizontal analysis by calculating the year-over-year changes in each line item, expressed in dollars and in percentages for the income statement of Insignia Corporation for the year ended December 31, 2015 (amounts in billions). 2-a. Conduct a vertical analysis by expressing each line as a percentage of total revenues. 2-b. Excluding income tax and other operating costs, did Insignia earn more profit per dollar of revenue in 2015 compared to 2014?
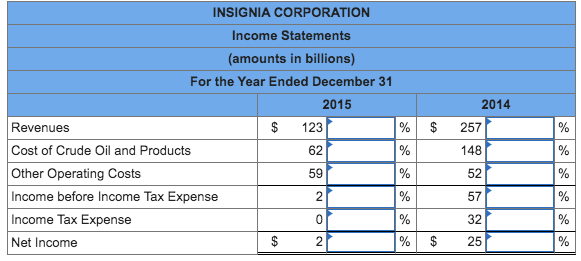
Q: In its 2017 annual report, Campbell Soup Company reports beginning-of-the-year total assets of…
A: Calculate the Average total assets:
Q: A. The following items were taken from the financial statements of Salley, Inc. over a three year…
A: Horizontal analysis is a type of financial statement analysis in which the financial items of one…
Q: Following are financial statement numbers and ratios for Lockheed Martin Corp. for the year ended…
A: Solution:- Projected revenue means the expected revenue for the year after considering all the…
Q: You are given the following information about Sandhill Plumbing Company. Revenues in 2017 totaled $…
A: Income statement represents the net income or net loss calculated by deducting the expenses from the…
Q: The trend analysis report of Doremon Ltd is given below: (in millions) 2020 2019 2018 2017 2016…
A: Trend analysis is a method of analyzing the financial statements. As per this method, one year is…
Q: Calculating trend analysis Muscateer Corp reported the following revenues and net income amounts:…
A: Requirement 1: Compute the trend in revenue.
Q: The average price of a gallon of gas in 2015 dropped $0.94 (28 percent) from $3.34 in 2014 (to $2.40…
A: I am answering the first three sub-parts as per bartleby guidelines. Please re-submit the remaining…
Q: You are given the following information about Sandhill Plumbing Company. Revenues in 2017 totaled $…
A: The income statement represents the net income or net loss that is calculated by deducting the…
Q: The average price of a gallon of gas in 2015 dropped $0.94 (28 percent) from $3.34 in 2014 (to $2.40…
A:
Q: XYZ Co. wants to know if its profitability performance has increased from 2009 to 2010. The company…
A: Return on Assets would be indicating the ability of company by using its assets for the generation…
Q: XYZ Co. wants to know if its profitability performance has increased from 2009 to 2010. The company…
A: Ratio analysis is a method of measuring the financial position of the organization with different…
Q: Did Baker’s net income as a percent of sales increase, decrease, or remain unchanged over the 3-year…
A:
Q: Grau Company reported sales revenue of $100,000 and total expenses of $90,000 (including…
A: Cash flow from operating activities: This section of cash flow statement provides information about…
Q: Revenue and expense data for Soldner Inc. are as follows: 2014 2013 Sales $1,500,000 $1,450,000…
A: The comparative income statement provides a comparative analysis of the income statements of two or…
Q: In 2015, ABC Corporation’s net income was ₱800,000 and in 2016 it was ₱200,000. What percentage…
A: Given: In 2015 net income of ABC Corporations is = 800000 In 2016 it was = 200000 To compute =…
Q: The average price of a gallon of gas in 2015 dropped $0.94 (28 percent) from $3.34 in 2014 (to $2.40…
A: 2015 Calculation 2014 Calculation Fixed Asset Turnover Ratio(Net Sales /…
Q: Sammy Corporation reported net sales of P300,000, P330,000, and P360,000 in the years, 2010, 2011,…
A: Given, Net sale of 2010 = P 300,000 Net sales of 2011 = P 330,000 Net sales of 2012 = P 360,000 Base…
Q: horizontal analysis by calculating the year-over-year changes in each line item,
A: Horizontal analysis: Horizontal analysis is also called a trend analysis to the analysis of the…
Q: The management of Bataan corporation asked you to submit an analysis of the increase in their gross…
A: Variance:- When there is a difference in the budgeted amount and what actually produces or occur is…
Q: The following is Macy's cash flows from 2006 to 2010: Year Cash Flow 2006 $1,406,000,000 2007 $…
A: When initial investment or investment amount is not given in question, we calculate internal rate of…
Q: Compute trend percentages for the following items taken from the financial statements of Lopez…
A: Trend analysis: Taking a particular year as base year and calculating the trend percentages over a…
Q: Assume the average price of a litre of gas in 2017 jumped $0.16 (15 percent) from $1.06 in 2010 to…
A: Gross profit % = (Income before tax/Total revenue)×100
Q: At year-end 2015, Wallace Landscaping’s total assets were $1.9 million and its accounts payable were…
A: To meet the business financial needs and operate the business, companies raise the funds from…
Q: Compute trend percentages for the following items taken from the financial statements of Lopez…
A: Trend analysis: It is the analysis in which a base year is selected and the change from the base…
Q: ompute the gross profit percentage for each year. Assuming that the change from 2014 to 2015 is the…
A:
Q: Jones Enterprises reported sales revenue totaling $672,000, $668,000, and $708,000 in the years,…
A: Here in this question we are require to determine trend analysis for the year of 2017. For…
Q: If a company had sales of $2,587,643 in 2008 and sales of $3,213,456 in2013, by what percentage did…
A:
Q: For 2014, Lindell Company reported its most significant decline in net income in years. At the end…
A: The income statement of two years is compared to know financial performance.
Q: The Pharoah Company has disclosed the following financial information in its annual reports for the…
A: Cash flows from operating activities: It is a section of Statement of cash flow that explains the…
Q: For 2014, Kasay Company initiated a sales promotion campaign that included the expenditure of an…
A: Income Statement:-It is a statement prepared during the period, it records all expenses and revenue…
Q: The following information is available to you for the Wooden Company:…
A: This ratio indicates the profit margin on sales i.e amount earned on the sales. it can be calculated…
Q: The average price of a gallon of gas In 2018 Increased $0.30 (12.4 percent) from $242 in 2017 to…
A: Since you have posted a question with multiple sub-parts, we will do the first three sub-parts for…
Q: Laflamme Inc. had the following operating results for 2018: sales $30,660, cost of goods sold =…
A:
Q: The average price of a gallon of gas in 2015 dropped $0.94 (28 percent) from $3.34 in 2014 (to $2.40…
A: Insignia Corporation's income statement for the year ending December 31, 2015, is shown below…
Q: In its 2014 annual report, Campbell Soup Company reports beginning-of-the-year total assets of…
A:
Q: Krogen Grocer’s 2016 financial statements show net income of $1,680 million, sales of $153,466…
A: Ratio analysis means where different ratio of various years of years companies has been compared and…
Q: Use the following information from Eiffel Company’s financial statements. 2018 Income Statement…
A: Cash flows from operating activities means cash inflows and cash outflows related to operations of…
Q: The following information pertains to Tonton Company for the year ended December 31, 2015: Net…
A: When a borrowing company holds monetary assets or liabilities in an inflationary situation and the…
Q: Target industries reported $11,500 of sales and $5,000 of operating costs (including depreciation).…
A: A method that helps to measure a company’s financial performance by deducting the overall cost of…
Q: For fiscal year 2015, Costco Wholesale Corporation (COST) had a net profit margin of 2.05%, asset…
A: Here, Net Profit Margin is 2.05% Asset Turnover Ratio is 3.48 Equity Multiplier is 3.15
Q: In 2015, ABC Corporation’s net income was ₱600,000 and in 2016 it was ₱100,000. What percentage…
A: The provided information are; Net income in the year 2015 = 600,000 Net income in the year 2016 =…
Q: The average price of a gallon of gas in 2015 dropped $0.94 (28 percent) from $3.34 in 2014 (to $2.40…
A: Ratio Analysis The calculation of Ratio analysis is to identify the strength and weakness of the…
Q: purchased additional equipment for $11.7 million at the end of 2016, and this equipment was…
A: Depreciation is the reduction in the value of fixed assets due to normal wear and tear, passage of…
Q: Given the historical income statement of Mega Trade Inc., how much would be added to the company's…
A: Net profits: Net profits are the amounts analyzed from the statement of profit or loss drafted at…
Q: Here is Finished Ltd.'s year-end statement of financial position as at December 31, 2016, which is…
A: IAS 29 explains the financial reporting in hyper-inflationary economies, which applies where…
Q: Suppose the years 2005 to 2009 were a period of rapid growth for a certain chain of coffeehouses and…
A: Asset turnover ratio = Total revenue/Average assets Profit margin ratio = Net income/total revenue…
Trending now
This is a popular solution!
Step by step
Solved in 4 steps
- The average price of a gallon of gas in 2015 dropped $0.94 (28 percent) from $3.34 in 2014 (to $2.40 in 2015) conduct a horizontal analysis by calculating the year-over-year changes in each line item, expressed in dollars and in percentages for the income statement of Insignia Corporation for the year ended December 31, 2015 (amounts in billions). (Decreases should be indicated by a minus sign)The average price of a gallon of gas in 2015 dropped $0.94 (28 percent) from $3.34 in 2014 (to $2.40 in 2015). Let’s see whether these changes are reflected in the income statement of Insignia Corporation for the year ended December 31, 2015 (amounts in billions). Insignia reported average net fixed assets of $190 billion in 2015 and $146 billion in 2014. Compute the fixed asset turnover ratios for both years. Did the company better utilize its investment in fixed assets to generate revenues in 2015 or 2014? Insignia reported average stockholders’ equity of $180 billion in 2015 and $146 billion in 2014. The company has not issued preferred stock. Compute the return on equity ratios for both years. Did the company generate greater returns for stockholders in 2015 or 2014?The average price of a gallon of gas in 2015 dropped $0.94 (28 percent) from $3.34 in 2014 (to $2.40 in 2015). Let’s see whether these changes are reflected in the income statement of Insignia Corporation for the year ended December 31, 2015 (amounts in billions). Compute the gross profit percentage for each year. Assuming that the change from 2014 to 2015 is the beginning of a sustained trend, is Insignia likely to earn more or less gross profit from each dollar of sales in 2016? Compute the net profit margin for each year. Given your calculations here and in requirement 1, explain whether Insignia did a better or worse job of controlling expenses other than the costs of crude oil and products in 2015 relative to 2014.
- The average price of a gallon of gas in 2015 dropped $0.94 (28 percent) from $3.34 in 2014 (to $2.40 in 2015). Let’s see whether these changes are reflected in the income statement of Insignia Corporation for the year ended December 31, 2015 (amounts in billions). 2015 2014 Revenues $ 245 $ 258 Cost of Purchased Crude Oil and Products 125 131 Other Operating Costs 61 55 Income before Income Tax Expense 59 72 Income Tax Expense 28 35 Net Income $ 31 $ 37 Required: Compute the gross profit percentage for each year. Assuming that the change from 2014 to 2015 is the beginning of a sustained trend, is Insignia likely to earn more or less gross profit from each dollar of sales in 2016? Compute the net profit margin for each year. Given your calculations here and in requirement 1, explain whether Insignia did a better or worse job of controlling expenses other than the costs of crude oil and products in…XYZ Co. wants to know if its profitability performance has increased from 2009 to 2010. The company had net income of $48,000 in 2009 and $50,000 in 2010. Total assets were $480,000 at the end of 2009, and $560,000 at the end of 2010. Calculate return on assets(ROA) for 2009 and 2010and Comment on the results.For 2014, Lindell Company reported its most significant decline in net income in years. At the end of the year, H. Finn, the president, is presented with the following condensed comparative income statement: Instructions1. Prepare a comparative income statement with horizontal analysis for the two-year period, using 2013 as the base year. Round to one decimal place.2. To the extent the data permit, comment on the significant relationships revealed by the horizontal analysis prepared in(1).
- Compute trend percentages for the following items taken from the financial statements of Lopez Plumbing over a five-year period. Treat 2014 as the base year. State whether the trends are favorable or unfavorable. (Dollar amounts are stated in thousands.) 2018 2017 2016 2015 2014 Sales $81,400 $74,000 $61,500 $59,000 $50,000 Cost of Goods Sold 58,500 48,000 40,500 37,000 30,000At year-end 2015, Wallace Landscaping’s total assets were $1.9 million and its accounts payable were $425,000. Sales, which in 2015 were $2.3 million, are expected to increase by 30% in 2016. Total assets and accounts payable are proportional to sales, and that relationship will be maintained. Wallace typically uses no current liabilities other than accounts payable. Common stock amounted to $430,000 in 2015, and retained earnings were $340,000. Wallace has arranged to sell $65,000 of new common stock in 2016 to meet some of its financing needs. The remainder of its financing needs will be met by issuing new long-term debt at the end of 2016. (Because the debt is added at the end of the year, there will be no additional interest expense due to the new debt.) Its net profit margin on sales is 7%, and 40% of earnings will be paid out as dividends. How much new long-term debt financing will be needed in 2016? (Hint: AFN - New stock = New long-term debt.) Do not round…James Furnishings generated $2 million in sales during 2016, and its year-end total assets were $1.5 million. Also, at year-end 2016, current liabilities were $500,000, consisting of $200,000 of notes payable, $200,000 of accounts payable, and $100,000 of accrued liabilities. Looking ahead to 2017, the company estimates that its assets must increase by $0.75 for every $1.00 increase in sales. James' profit margin is 3%, and its retention ratio is 35%. How large of a sales increase can the company achieve without having to raise funds externally? Write out your answer completely. For example, 25 million should be entered as 25,000,000. Do not round intermediate calculations. Round your answer to the nearest cent.
- Given the income statement below, Mega Trade Inc. wants to find the resulting net income for the year 2018 (in million). What is the right amount? Income Statement ($ Million) Year End 2015 2016 2017 2018 Sales 1,234.90 1,251.70 1,300.40 1,334.40 Cost of Sales -679.1 -659 -681.3 -667 Selling & Administration -339.7 -348.6 -351.2 -373.3 Depreciation -47.5 -52 -55.9 -75.2 Other Income/Expenses 11.8 7.6 7 8.2 Interest Income 1.3 1.4 1.7 2 Interest Expense -16.2 -15.1 -20.5 -23.7 Income Taxes -56.8 -64.2 -67.5 -72.6 Dividends -38.3 -38.7 -39.8 -40.1 CHOICES: A. 108.7B. 132.7C. No choice givenD. 132.8E. 121.8The average price of a gallon of gas in 2015 dropped $0.94 (28 percent) from $3.34 in 2014 (to $2.40 in 2015). Conduct a vertical analysis by expressing each line as a percentage of total revenues. (Round percentage values to 1 decimal place.)Suppose the years 2005 to 2009 were a period of rapid growth for a certain chain of coffeehouses and the company's revenues grew by more than 50% during that period. Use the hypothetical financial data for the company to answer the questions. chart shown (attached) then questions: (A): Calculate the asset turnover ratio for 2008 and 2009. (Round your answers to two decimal places.) 2008= 2009= (B): Calculate the net profit margin (as a %) for 2007, 2008, and 2009. (Round your answers to the nearest tenth of a percent.) 2007 = % 2008 = % 2009 = % (C): Calculate the return on investment (as a %) for 2007, 2008, and 2009. (Round your answers to the nearest tenth of a percent.) 2007 = % 2008 = % 2009 = %