purchased additional equipment for $11.7 million at the end of 2016, and this equipment was depreciated by $3.9 million per year in 2017, 2018, and 2019. Given Mydeco‘s tax rate of 35%, what impact would this additional purchase have had on Mydecco’s net income in years 2016-2019? Assume that the equipment is paid for out of cash and that Mydeco earns no interest on its cash balances. In the table, calculate the new net income below. **round to one decimal place**
purchased additional equipment for $11.7 million at the end of 2016, and this equipment was depreciated by $3.9 million per year in 2017, 2018, and 2019. Given Mydeco‘s tax rate of 35%, what impact would this additional purchase have had on Mydecco’s net income in years 2016-2019? Assume that the equipment is paid for out of cash and that Mydeco earns no interest on its cash balances. In the table, calculate the new net income below. **round to one decimal place**

Financial Accounting
14th Edition
ISBN:9781305088436
Author:Carl Warren, Jim Reeve, Jonathan Duchac
Publisher:Carl Warren, Jim Reeve, Jonathan Duchac
Chapter6: Accounting For Merchandising Businesses
Section: Chapter Questions
Problem 7PEA: Financial statement data for years ending December 31 for Latchkey Company follows: a. Determine the...

Related questions
Question
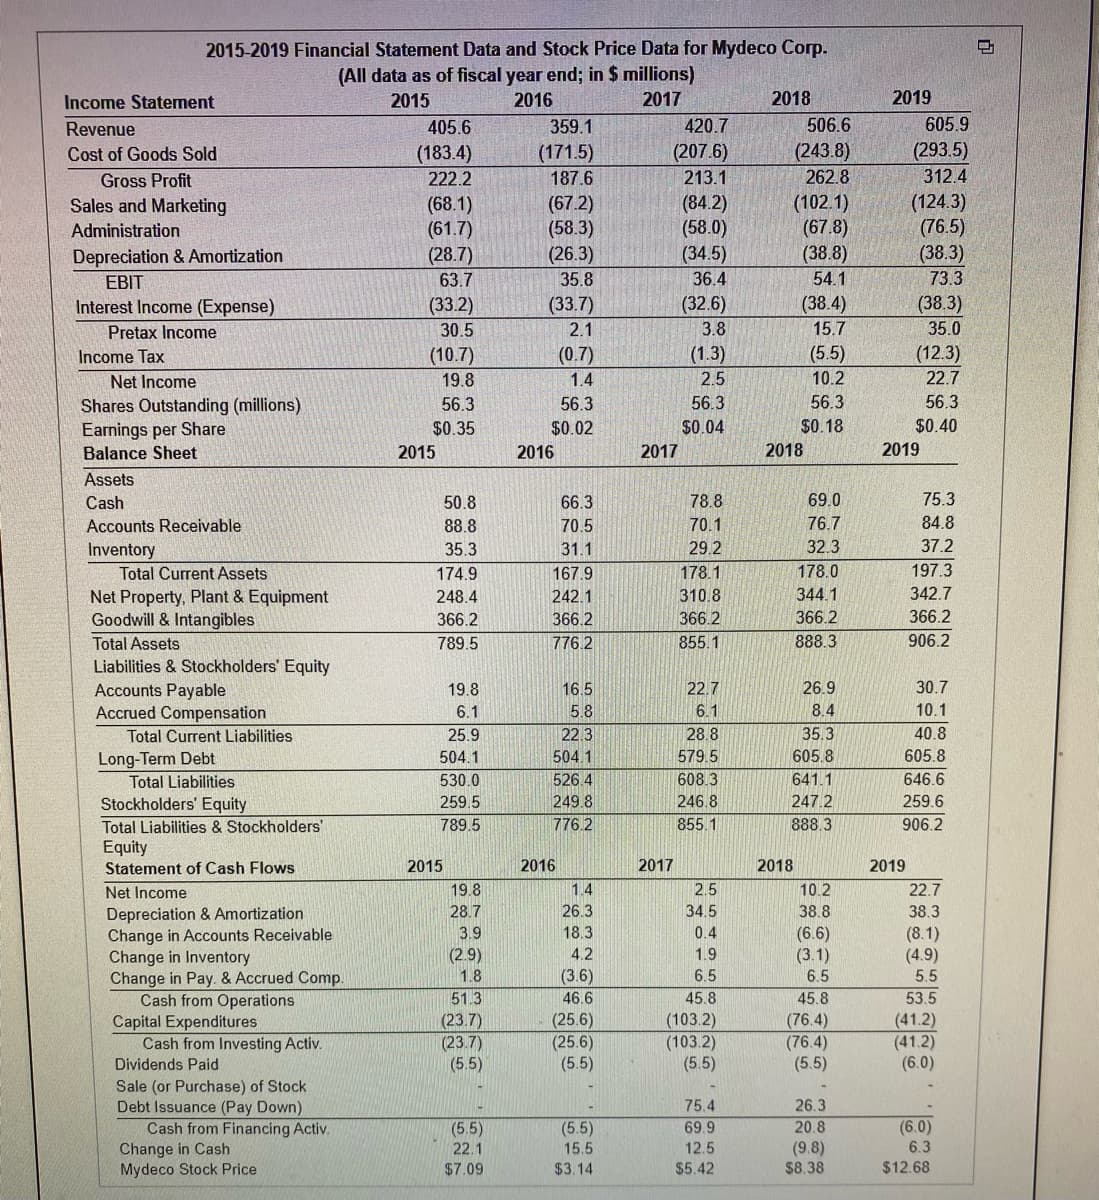
The data table shows financial statement data and stock price data for Mydeco Corp. Suppose Mydeco had purchased additional equipment for $11.7 million at the end of 2016, and this equipment was depreciated by $3.9 million per year in 2017, 2018, and 2019. Given Mydeco‘s tax rate of 35%, what impact would this additional purchase have had on Mydecco’s net income in years 2016-2019? Assume that the equipment is paid for out of cash and that Mydeco earns no interest on its cash balances.
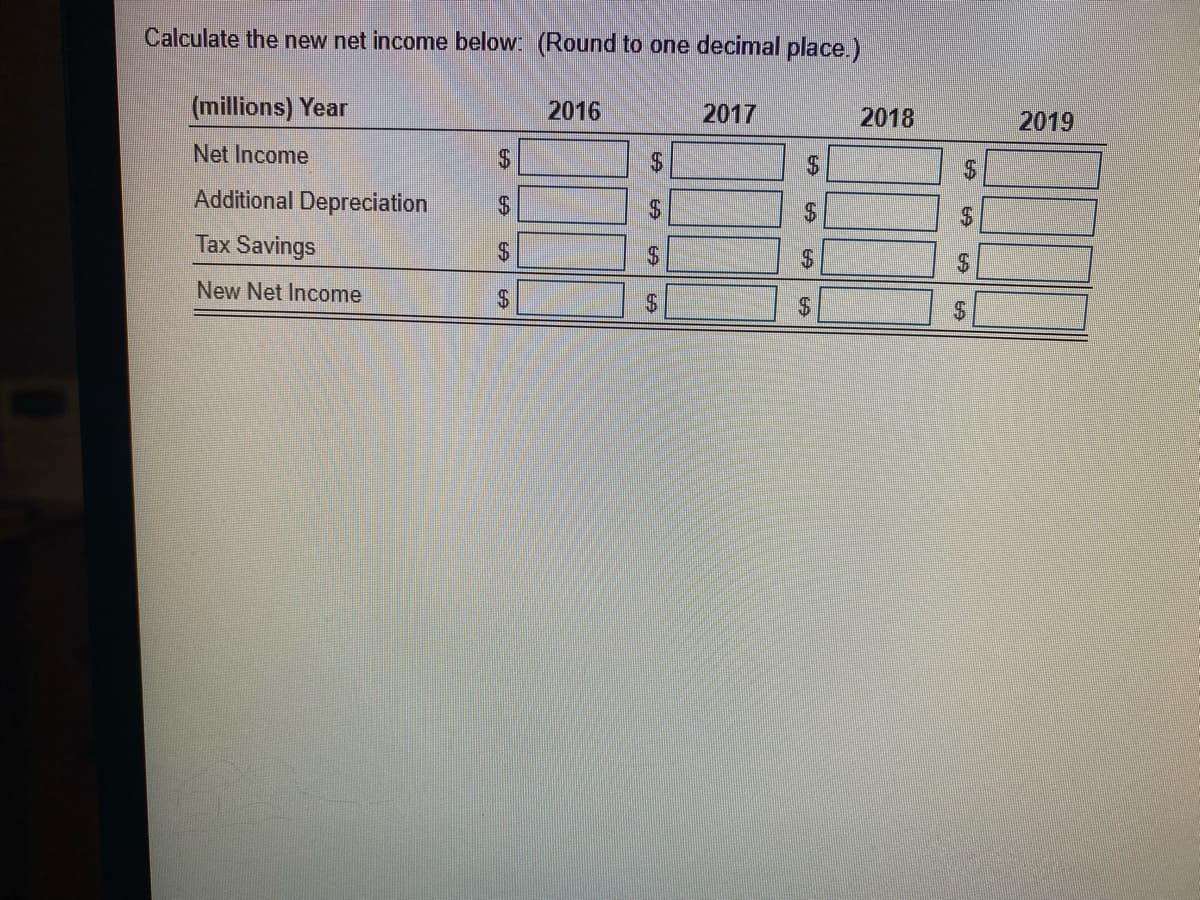
In the table, calculate the new net income below.
**round to one decimal place**
Transcribed Image Text:2015-2019 Financial Statement Data and Stock Price Data for Mydeco Corp.
(All data as of fiscal year end; in $ millions)
2015
Income Statement
2016
2017
2018
2019
Revenue
405.6
359.1
420.7
506.6
605.9
(207.6)
(293.5)
(243.8)
262.8
Cost of Goods Sold
(183.4)
(171.5)
Gross Profit
222.2
187.6
213.1
312.4
(67.2)
(58.3)
(26.3)
(84.2)
(58.0)
(34.5)
(102.1)
(67.8)
(38.8)
(124.3)
(76.5)
(38.3)
Sales and Marketing
(68.1)
(61.7)
(28.7)
63.7
Administration
Depreciation & Amortization
EBIT
35.8
36.4
54.1
73.3
Interest Income (Expense)
(33.2)
(33.7)
(32.6)
(38.4)
(38.3)
Pretax Income
30.5
2.1
3.8
15.7
35.0
Income Tax
(10.7)
(0.7)
(1.3)
(5.5)
(12.3)
Net Income
19.8
1.4
2.5
10.2
22.7
56.3
56.3
56.3
Shares Outstanding (millions)
Earnings per Share
Balance Sheet
56.3
56.3
$0.35
$0.02
$0.04
$0. 18
$0.40
2015
2016
2017
2018
2019
Assets
Cash
50.8
66.3
78.8
69.0
75.3
Accounts Receivable
88.8
70.5
70.1
76.7
84.8
Inventory
35.3
31.1
29.2
32.3
37.2
Total Current Assets
174.9
167.9
178.1
178.0
197.3
242.1
310.8
344.1
342.7
Net Property, Plant & Equipment
Goodwill & Intangibles
248.4
366.2
366.2
366.2
366.2
366.2
Total Assets
789.5
776.2
855.1
888.3
906.2
Liabilities & Stockholders' Equity
Accounts Payable
Accrued Compensation
19.8
16.5
22.7
26.9
30.7
6.1
5.8
6.1
8.4
10.1
Total Current Liabilities
25.9
22.3
28.8
35.3
40.8
Long-Term Debt
504.1
504.1
579.5
605.8
605.8
Total Liabilities
530.0
526.4
608.3
641.1
646.6
249.8
246.8
247.2
259.6
Stockholders' Equity
Total Liabilities & Stockholders'
Equity
Statement of Cash Flows
259.5
789.5
776.2
855.1
888.3
906.2
2015
2016
2017
2018
2019
Net Income
19.8
1.4
2.5
10.2
22.7
28.7
Depreciation & Amortization
Change in Accounts Receivable
Change in Inventory
Change in Pay. & Accrued Comp.
Cash from Operations
Capital Expenditures
Cash from Investing Activ.
26.3
34.5
38.8
38.3
3.9
18.3
0.4
(6.6)
(3.1)
6.5
(8.1)
(4.9)
5.5
4.2
(2.9)
1.8
1.9
(3.6)
6.5
51.3
46.6
45.8
45.8
53.5
(23.7)
(23.7)
(5.5)
(25.6)
(25.6)
(5.5)
(103.2)
(103.2)
(5.5)
(76.4)
(76.4)
(5.5)
(41.2)
(41.2)
(6.0)
Dividends Paid
Sale (or Purchase) of Stock
Debt Issuance (Pay Down)
Cash from Financing Activ.
Change in Cash
Mydeco Stock Price
75.4
26.3
(5.5)
(5.5)
69.9
20.8
(6.0)
(9.8)
$8.38
22.1
15.5
12.5
6.3
$7.09
$3.14
$5.42
$12.68
Transcribed Image Text:Calculate the new net income below: (Round to one decimal place.)
(millions) Year
2016
2017
2018
2019
Net Income
$4
Additional Depreciation
24
24
Tax Savings
24
New Net Income
%24
%24
%%24
%24
%24
%24
%24
%24
%24
Expert Solution
Step 1
Depreciation is the reduction in the value of fixed assets due to normal wear and tear, passage of time, etc.

Trending now
This is a popular solution!

Step by step
Solved in 3 steps

Recommended textbooks for you
Financial Accounting
Accounting
ISBN:
9781305088436
Author:
Carl Warren, Jim Reeve, Jonathan Duchac
Publisher:
Cengage Learning

Cornerstones of Financial Accounting
Accounting
ISBN:
9781337690881
Author:
Jay Rich, Jeff Jones
Publisher:
Cengage Learning

Survey of Accounting (Accounting I)
Accounting
ISBN:
9781305961883
Author:
Carl Warren
Publisher:
Cengage Learning
Financial Accounting
Accounting
ISBN:
9781305088436
Author:
Carl Warren, Jim Reeve, Jonathan Duchac
Publisher:
Cengage Learning
Cornerstones of Financial Accounting
Accounting
ISBN:
9781337690881
Author:
Jay Rich, Jeff Jones
Publisher:
Cengage Learning
Survey of Accounting (Accounting I)
Accounting
ISBN:
9781305961883
Author:
Carl Warren
Publisher:
Cengage Learning

Financial & Managerial Accounting
Accounting
ISBN:
9781285866307
Author:
Carl Warren, James M. Reeve, Jonathan Duchac
Publisher:
Cengage Learning

Intermediate Accounting: Reporting And Analysis
Accounting
ISBN:
9781337788281
Author:
James M. Wahlen, Jefferson P. Jones, Donald Pagach
Publisher:
Cengage Learning

Financial Accounting: The Impact on Decision Make…
Accounting
ISBN:
9781305654174
Author:
Gary A. Porter, Curtis L. Norton
Publisher:
Cengage Learning