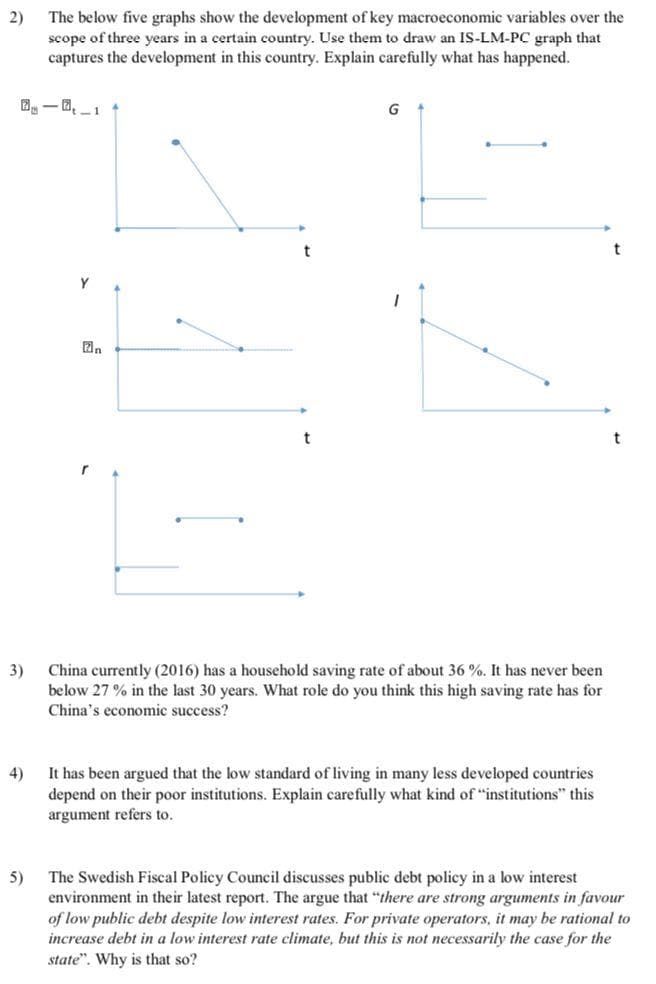
The below five graphs show the development of key macroeconomic variables over the scope of three years in a certain country. Use them to draw an IS-LM-PC graph that captures the development in this country. Explain carefully what has happened.
Q: a) how many degrees of freedom are there in this equation b) differentiate the Equation c) Put dM…
A: The macroeconomic model of IS-LM establishes a relation between the interest (r) rate and the…
Q: Using the AD/AS model, explain how each of the following hypothetical Government policies would…
A: Aggregate demand refers to the situation when the economy as a whole is considered to want something…
Q: The below five graphs show the development of key macroeconomic variables over the scope of three…
A: The IS-LM-PC is defined as a model which is known as the Income Spending, Monetary Policy and the…
Q: Explain, using the AD-AS model, the effect of an increase in investment in the macroeconomy on the…
A: Meaning of Aggregate Demand and Aggregate Supply: The term aggregate demand refers to the situation…
Q: Price Price Quantity Quantity Good (Year (Year 2007) (Year 2007) (Year 2008) 2008) Rent $2000 12…
A:
Q: Covid-19 has a huge impact on aggregate economic activities, please discuss this impact and explain…
A: The Covid-19 has led to the fall in the aggregate demand significantly. It has adversely impacted…
Q: From 1/1/2020 to 7/1/2020, real GDP decreased but the GDP deflator stayed approximately the same…
A: In an economy, changes in real GDP and nominal GDP will affects the the value of GDP deflator and it…
Q: In the past two decades, the government of Qatar has made significant investments to increase the…
A:
Q: Can LRAS be shifted? What are the factors that caused LRAS to shift?
A: The aggregate supply (AS) refers to the total volume of services and goods produced in the economy…
Q: Explain thé importáñčé óf macroeconomics in an economy
A: According to the given question It is the macroeconomic which is not concerned with a single…
Q: Use the AD-AS model to explain the impact of a general increase in productivity on the general price…
A: In an economy, the AD-AS model explains the condition of a goods market and the price and quantity…
Q: Assume there is a particular short-run aggregate supply curve for an economy and the curve is…
A:
Q: Use the basic AD-AS model to illustrate and describe the effect of unexpected increase in the oil…
A: The unexpected increase in the price of oil means that the cost of production in the economy will…
Q: Which of the following could explain the shift shown in the graph above form AD to AD'? (Check all…
A: Here the aggregate demand curve shift left ward.
Q: Movement of Labor and Capital Between Countries In the short-run specific-factors model, consider a…
A: GIVEN Movement of Labor and Capital Between Countries In the short-run specific-factors model,…
Q: Depict in the AD-AS model, an economy exhibiting a short run equilibrium with a negative output gap…
A: In the graph, initial long-run equilibrium is at point A where AD0 (aggregate demand), LRAS0…
Q: Why is labor productivity growth considered to be one of the most important factors in the AD/AS…
A: Productivity growth is considered to be one of the most important factors in the AD/AS model because
Q: Imagine that in the year 2025, China’s economy increases significantly, causing an increase in…
A: The income of a person and their consumption are directly related. If the income of a person rises,…
Q: Assume that an economy operates according to the sticky-wage model. The nominal wage was set to make…
A: In Macroeconomics, Sticky wage is a concept where nominal wage is resistant to change. Wages changes…
Q: Given the economic conditions depicted by the graph, answer the following questions. True or False:…
A: The above diagram depicts a situation where the economy is in short-run equilibrium. The point where…
Q: a) List at least four (4) sources of positive economic growth in an economy and discuss how these…
A: AD/AS Model: It refers to that model under which economic growth can be seen with the help of…
Q: Macropoland, a country that is a natural gas and oil importer, has a natural rate of unemployment…
A: Meaning of Inflation: The term inflation refers to the situation under which there is an excessive…
Q: For each of the following scenarios predict how the price level and output will change over time…
A:
Q: What determines the current demand for labour? In the intertemporal model, the current demand for…
A: ▪︎ The current demand for labour is determined by the following factors: • The amount of cooperating…
Q: The model of aggregate demand and aggregate supply is different from the model of supply and…
A: Aggregate demand is the total demand of finished goods and services in the economy in given time…
Q: Changes in macroeconomic indicators can often be of relevance to business and influence…
A: Answer: Introduction: Changes in macroeconomic indicators can often be of relevance to business and…
Q: In the Short-Run Macroeconomic model, what happens when the Supply slope shifts to the right? A.…
A: Short run supply curve is an upward sloping curve which shows a direct relation between price and…
Q: What must be true of the model parameters and variables of the AD-AS curves in the long-run…
A:
Q: In business forecasting using multiplicative decomposition which data component do you use to…
A: Business forecasting is the practice of making educated assumptions about particular business…
Q: On the following graph, plot the aggregate demand curve that results from varying the price level…
A: The aggregate demand curve is a curve that represents the sum of the quantity of all goods and…
Q: What happens in the circular flow model during a recession.
A: The circular flow model represent show money flows from one economics sector to another and how it…
Q: Distinguish between the following concepts as they apply to Elements of Macroeconomics. Give…
A: The difference between nominal GDP and real GDP. Nominal GDP Real GDP The value of the final…
Q: What is an aggregate? How is it used in macroeconomics? Give two examples of specific aggregates…
A: The word aggregate used for something in totality.
Q: Beginning in March 2013, federal government spending was resstrained due to the sequester (feel free…
A: Federal spending: It is the spending by government and a part of aggregate demand. Aggregate Demand…
Q: The following graph approximates business cycles in the United States from the first quarter of 1955…
A: a) Real GDP trends upward over time but experience ups and downs in the short run. A period of…
Q: Use the production function of the hypothetical economy 1000 represented in the graph to answer the…
A: Answer: Introduction: The steady-state level of output: steady-state capita is the state where…
Q: briefly explain the two importan circular flow of model
A: The circular flow model represents the flow of money in an economy.
Q: Suppose final demand changes to 77 for Health, 154 Oil, and 231 for Housing. Find the output matrix…
A:
Q: What actions might a business owner take during times of economic contraction? In other words, how…
A: Business cycles represent those periods of cyclical fluctuations that occur in an economy in terms…
Q: Changes in macroeconomic indicators can often be of relevance to business and influence…
A: Singapore's economy is highly affected by the electronic sector as it contributes a significant…
Q: Discuss in detail the macroeconomic circular flow diagram. Provide a diagram to help with your…
A: We can describe macroeconomic flow by the following diagram,
Q: What impact would a decrease in the size of the labour force have on GDP and the price level…
A: Aggregate demand explains the relationship between the general price level and the level of real GDP…
Q: How does AD/AS Model Incorporates Economic Growth, unemployment, and inflation. Identify periods of…
A: Aggregate demand refers to the amount of sales proceeds which an entrepreneur actually except from…
Q: Macroeconomics is concerned with: only long-run trends in economic activity. only short-run…
A: Correct: both long-run trends and short-term fluctuations in economic activity.
Q: Write the definition of Macroeconomics with example? Describe the concept of aggregate demand and…
A: “Since you have asked multiple questions, we will solve the first question for you. If you want any…
Q: Explain in details the model graph in the North West Government North-West economy LRAS SRAS P1 E1…
A: Graph is related with AS AD model . Where LRAS is vertical line which means that production can't be…
Step by step
Solved in 6 steps with 5 images
- Suppose an economy produces only 2 products that will also be used for directconsumption, as per the article at the end of the exam: chicken wings and donuts. Inthe second quarter of 2021 (the base period), 180,000 pounds of chicken wings wereproduced, at a value of $3.50 per pound, while in the second quarter of 2022,production of chicken wings increased to 200,000 pounds, at a value of $3.75 perpound. In the second quarter of 2021 (the base period), 85,000 donuts were producedat a value of $0.85 per donut, while in the second quarter of 2022, donut productionincreased to 100,000 donuts, each at a value of $0.95 per donut. The population inthis economy is 1000 individuals in 2022, while the number of hours worked in 2022is 5000. Also, the quantities that were produced in 2021 represent the quantities thatwere purchased by the typical household, meaning that everything that was producedwas sold.d. Solve for the amount of labor productivity in the second quarter of 2022.e. Solve for the…b. Explain the difference between saving and investment as defined by a macroeconomist. c. Which of the following situations in c (i) & c (ii) represent investment? Saving? Explain(i) Your family takes out a mortgage and buys a new house. (ii) You use your paycheque to buy stock in Sagicor Financial Services.The long run macroeconomic performance of an economy can be reflectedfrom the changes of her major macroeconomic indicators. With appropriateinterpretations of the changes to these indicators, one can identify the inherentstructural features of an economy, and hence, identify her strengths andweaknesses. In about 250 words, write a short essay on ONE economy from the list below:i. Singapore;ii. The United Kingdom;iii. The United States.In your essay, describe the changes of major macroeconomic indicators fromthe last decade. Using them to illustrate major structural features of the choseneconomy. Based on the above, identify ONE inherent problem implied bythese structural features that might limit her macroeconomic performance inthe long run. Suggest ONE practical government policy in dealing with thisinherent problem.
- 7. Consider a neoclassical growth economy described by the following.•Yt = K0.3t ·L0.7t (aggregate production function)•s = 0.35 (saving rate)•δ = 0.10 (depreciation rate)•n = 0.01 (population growth rate)•L1 = 120 (initial population)•K1 = 160 (initial capital stock)•g = 0 (technological growth rate)Compute K, Y , k, y, and c for the first three periods. Please report numerical answers to two decimal points.Consider an economy called Xanadu for which desired aggregate consumptiondepends on income, Y. and the real interest rate, r, according toCd =100+0.7Y - 200r.Xanadu's GDP is Y = 1000 and government spending on goods and services is G=180. Xanadu's desired future capital stock is given byK* = 140 - 100ucwhere luCdenotes the user-cost of capital. The price of capital is PK =2, thephysical depreciation rate is d =0.1 and the existing capital stock is K0= 50. Trapital stock between any period t and the following period t+1 evolves accordng toKt+1 = It+(1-d)Kt where It the level of investment. Assume throughout that net factor payments from abroad (NFP) is equal to zero.Suppose instead that Xanadu is a small open economy facing a world interest rate of 1%. It follows that Xanadu's current account position is equal toA) -16B) -51C) -6D) -81. Suppose the labor market is initially at its equilibrium, i.e., labor supplied equals labor demanded. Explain and show graphically the effects of an increase in the economy’s capital stock. Please draw the full graph and provide a detailed explanation of the effect. Label the axes and explain why either the labor demand curve or the labor supply curve shifts. 2. Suppose the goods market is initially at its equilibrium, i.e., the desired level of national saving equals the desired level of investment. Explain and show graphically how an increase of the effective tax rate on capital goods affects the goods market equilibrium. Please draw the full graph and provide a detailed explanation of the effect. Label the axes and explain why either the saving curve or the investment curve shifts.
- Given that the individual is a saver, show the impact of:i) An increase in interest rate on Current and future consumption levels when SE > IEii) A decrease in interest rate on Current and future consumption levels when SE < IEWhen comparing National with Regional Input-Output models, the issue of “leakages” often comes up. what is a “leakage? Also explain the impact that a leakage has on an economy’s multipliers and what this means for measure of economic impactUsing quarterly data from 1947 to the present, graph residential fixed investment relative to GDP a. Compare the graph of residential investment relative to GDP to a graph of the civilian unemployment rate. What happens to residential investment during recessions? In this respect, is residential investment similar to or different from other types of investment? b. During the two decades after World War II, there was an upsurge in population growth and household formation known as the “baby boom.” The baby boom was followed by a “baby bust” during which population growth slowed. How are these demographic trends connected to the behavior of residential investment relative to GDP shown in your graph?
- How is interest rate calculated when using intertemporal consumption between two periods. Can a formula be provided, please? Subject area intertemporal consumption (microeconomics) For reference : Income 1 Income 2 Consumption 1 Consumption 2 (How is the interest rate calculated if given the figures for Income 1, Income 2, Consumption 1 and Consunpmtion 2 . Please explainChina’s real GDP increased 6.9 percent in the first quarter of 2017 from a year earlier.Investment grew by 9.2 percent and retail sales by 10.9 percent. In current prices, GDPincreased by 11.8 percent from a year earlier.1. Explain how China’s real GDP can grow at a 6.9 percent rate when consumption andinvestment grew faster than 6.9 percent. 2. Explain why the growth rate of GDP in current prices does not provide informationabout how quickly the economy is really growing.Explain the difference between saving andinvestment as defined by a macroeconomist. Whichof the following situations represent investment andwhich represent saving? Explain.a. Your family takes out a mortgage and buys a newhouse.b. You use your $200 paycheck to buy stock in AT&T.c. Your roommate earns $100 and deposits it in hisaccount at a bank.d. You borrow $1,000 from a bank to buy a car to usein your pizza delivery business.