The below shown graph is drawn from the tabulated values of brass which we measured during the experiment of thermal conductivity: (Consider the value of heater power (Q') and the area of cross section (A) of the material from the tabulated values) Q(w)=14.65 -axis 1 unit lcm yaxis 1 unit =5°c s0- 30- 20- 10- 1 2 Distance of the best point from the hot end in centimeter Calculate the following: Thermal conductivity of brass Calculated Value quantities Difference in temperature (AT) C° (with sign) Difference in distance between test points (Ax) cm Slope from the graph °C/m (with sign) Thermal conductivity of brass kь W/m°C
The below shown graph is drawn from the tabulated values of brass which we measured during the experiment of thermal conductivity: (Consider the value of heater power (Q') and the area of cross section (A) of the material from the tabulated values) Q(w)=14.65 -axis 1 unit lcm yaxis 1 unit =5°c s0- 30- 20- 10- 1 2 Distance of the best point from the hot end in centimeter Calculate the following: Thermal conductivity of brass Calculated Value quantities Difference in temperature (AT) C° (with sign) Difference in distance between test points (Ax) cm Slope from the graph °C/m (with sign) Thermal conductivity of brass kь W/m°C

Chapter1: Temperature And Heat
Section: Chapter Questions
Problem 128CP: As the very first rudiment of climatology, estimate the temperature of Earth. Assume it is a perfect...

Related questions
Question
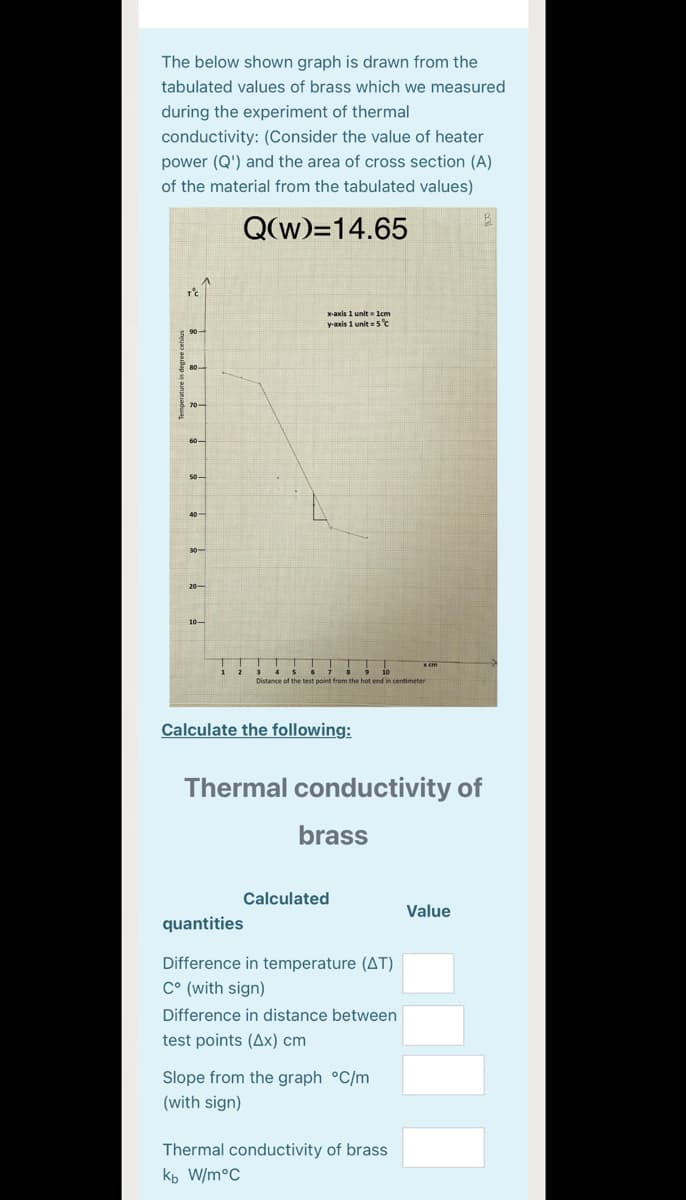
Transcribed Image Text:The below shown graph is drawn from the
tabulated values of brass which we measured
during the experiment of thermal
conductivity: (Consider the value of heater
power (Q') and the area of cross section (A)
of the material from the tabulated values)
Q(w)=14.65
X-axis 1 unit lcm
y-axis 1 unit =5°C
30-
20-
10-
Distance of the best point from the hot end in centimeter
Calculate the following:
Thermal conductivity of
brass
Calculated
Value
quantities
Difference in temperature (AT)
C° (with sign)
Difference in distance between
test points (Ax) cm
Slope from the graph °C/m
(with sign)
Thermal conductivity of brass
kь W/m°C
Expert Solution
This question has been solved!
Explore an expertly crafted, step-by-step solution for a thorough understanding of key concepts.

Step by step
Solved in 2 steps

Knowledge Booster


Learn more about
Need a deep-dive on the concept behind this application? Look no further. Learn more about this topic, physics and related others by exploring similar questions and additional content below.Recommended textbooks for you

Principles of Physics: A Calculus-Based Text
Physics
ISBN:
9781133104261
Author:
Raymond A. Serway, John W. Jewett
Publisher:
Cengage Learning
Principles of Physics: A Calculus-Based Text
Physics
ISBN:
9781133104261
Author:
Raymond A. Serway, John W. Jewett
Publisher:
Cengage Learning