MATLAB: An Introduction with Applications
6th Edition
ISBN: 9781119256830
Author: Amos Gilat
Publisher: John Wiley & Sons Inc
expand_more
expand_more
format_list_bulleted
Concept explainers
Question

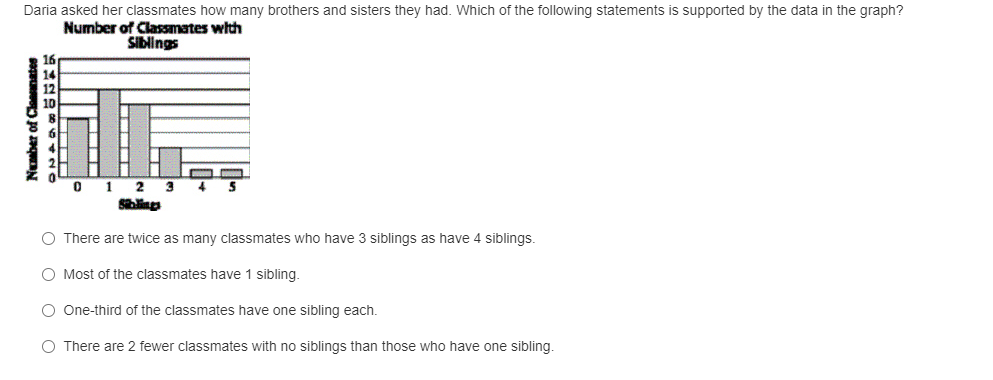
Transcribed Image Text:Daria asked her classmates how many brothers and sisters they had. Which of the following statements is supported by the data in the graph?
Number of Classmates with
Siblings
1 2
3
O There are twice as many classmates who have 3 siblings as have 4 siblings.
O Most of the classmates have 1 sibling.
O One-third of the classmates have one sibling each.
O There are 2 fewer classmates with no siblings than those who have one sibling
Expert Solution

This question has been solved!
Explore an expertly crafted, step-by-step solution for a thorough understanding of key concepts.
This is a popular solution
Trending nowThis is a popular solution!
Step by stepSolved in 2 steps

Knowledge Booster
Learn more about
Need a deep-dive on the concept behind this application? Look no further. Learn more about this topic, statistics and related others by exploring similar questions and additional content below.Similar questions
- Twelve husbands were asked how much housework they completed last week and how many children were in the home. Use the following data to complete the questions in this section. Write out the linear model. Children Husband’s Housework Children Husband’s Housework 2 4 4 6 1 1 1 3 3 0 3 5 5 4 2 3 1 5 2 1 5 7 4 3arrow_forwardWhat percentage of data would you predict would be between 25 and 50 and what percentage would you predict would be more than 50 miles? Use the Week 4 spreadsheet again to find the percentage of the data set we expect to have values between 25 and 50 as well as for more than 50. Now determine the percentage of data points in the dataset that fall within each of these ranges, using same strategy as above for counting data points in the data set. How do each of these compare with your prediction and why is there a difference? Predicted percentage between 25 and 50: ________________________ Actual percentage: Predicted percentage more than 50 miles: Actual percentage: ___________________________________________ Comparison ____________________________________________________ Why? __________________________________________________________ Drive: 44 20 88 6 71 42 76 63 61 63 84 28 55 33 88 80 86 83 5 85 25 25 54 54 81 73 29 76 78…arrow_forwardA retailer wants to see if a red "Sale" sign brings in more revenue than the same "Sale" sign in blue. The data below shows the revenue in thousands of dollars that was achieved for various days when the retailer decided to put the red "Sale" sign up and days when the retailer decided to put the blue "Sale" sign up. Red: 2.7, 2.6, 1.1, 4.2, 2.6, 3.4, 2.3, 2.9, 4, 2.6 Blue: 2.2, 1, 2.8, 1.6, 0.6, 0.9, 1, 1.7, 3.4 Assume that both populations follow a normal distribution. What can be concluded at the a = 0.01 level of significance level of significance? b. The test statistic t î = (please show your answer to 3 decimal places.) c. The p-value = (Please show your answer to 4 decimal places.)arrow_forward
- Mrs. Harris is studying whether eating breakfast the day of an achievement test produces higher test scores in her 6th grade classroom. The data is shown in the tables below.Achievement Test Scores: No Breakfast Student Score Student A 248 Student B 277 Student C 245 Student D 256 Student E 255 Student F 279 Student G 281 Student H 265 Achievement Test Scores: After Eating Breakfast Student Score Student J 271 Student K 244 Student L 280 Student M 284 Student N 259 Student P 267 Student R 258 Student S 275 Identify the important pieces of information needed to decide if there is a statistically significant difference in the data sets (null hypothesis, alternative hypothesis, one- or two- tailed test, sample size for each group). a The null hypothesis is eating breakfast before an achievement test has no effect on test scores.The alternative hypothesis is eating breakfast before an achievement test produces higher test…arrow_forwardNeed it asap pls.arrow_forwardfill blanks.arrow_forward
- Experimental or Observational: A group of students is interested in knowing if the number of times they can sink a basketball is related to the color of the basketball. The students shoot a series of baskets and record their success using a regulation colored basketball. They then switch to a blue colored basketball and shoot the same series of baskets. .arrow_forwardA teacher was listening to some of her students talk about how many SnapChats they send during the day. The teacher decided that she wanted to conduct a study to see if the number of SnapChats a student sends per day affects how much time students talk to their friends face-to-face. So, the teacher let her 2nd period class continue sending Snaps as they always have. Then, the teacher told her 5th period that they were to not watch use SnapChat for a whole day. Then, the teacher had students record how many conversations they had with their friends during the week, gathered the data, and analyzed the results. c. What was the research question?arrow_forward
arrow_back_ios
arrow_forward_ios
Recommended textbooks for you
- MATLAB: An Introduction with ApplicationsStatisticsISBN:9781119256830Author:Amos GilatPublisher:John Wiley & Sons IncProbability and Statistics for Engineering and th...StatisticsISBN:9781305251809Author:Jay L. DevorePublisher:Cengage LearningStatistics for The Behavioral Sciences (MindTap C...StatisticsISBN:9781305504912Author:Frederick J Gravetter, Larry B. WallnauPublisher:Cengage Learning
- Elementary Statistics: Picturing the World (7th E...StatisticsISBN:9780134683416Author:Ron Larson, Betsy FarberPublisher:PEARSONThe Basic Practice of StatisticsStatisticsISBN:9781319042578Author:David S. Moore, William I. Notz, Michael A. FlignerPublisher:W. H. FreemanIntroduction to the Practice of StatisticsStatisticsISBN:9781319013387Author:David S. Moore, George P. McCabe, Bruce A. CraigPublisher:W. H. Freeman

MATLAB: An Introduction with Applications
Statistics
ISBN:9781119256830
Author:Amos Gilat
Publisher:John Wiley & Sons Inc

Probability and Statistics for Engineering and th...
Statistics
ISBN:9781305251809
Author:Jay L. Devore
Publisher:Cengage Learning

Statistics for The Behavioral Sciences (MindTap C...
Statistics
ISBN:9781305504912
Author:Frederick J Gravetter, Larry B. Wallnau
Publisher:Cengage Learning

Elementary Statistics: Picturing the World (7th E...
Statistics
ISBN:9780134683416
Author:Ron Larson, Betsy Farber
Publisher:PEARSON

The Basic Practice of Statistics
Statistics
ISBN:9781319042578
Author:David S. Moore, William I. Notz, Michael A. Fligner
Publisher:W. H. Freeman

Introduction to the Practice of Statistics
Statistics
ISBN:9781319013387
Author:David S. Moore, George P. McCabe, Bruce A. Craig
Publisher:W. H. Freeman