The College Board SAT college entrance exam consists of three parts: math, writing, and critical reading. Sample data showing the math and writing scores for a sample of 12 students who took the SAT follow. Two samples are dependent with matched data. Student Math Writing Student Math Writing 540 474 480 430 432 380 499 459 528 463 615 541 610 574 612 10 572 390 593 448 420 11 335 502 526 12 613 Use a 0.05 level of significance and test for a difference between the population mean for the math a. scores and the population mean for the writing scores. What is the p-value and what is your conclusion? b. What are the estimates of the population mean scores for the two tests? Which test reports the higher mean score? 1234 n6
The College Board SAT college entrance exam consists of three parts: math, writing, and critical reading. Sample data showing the math and writing scores for a sample of 12 students who took the SAT follow. Two samples are dependent with matched data. Student Math Writing Student Math Writing 540 474 480 430 432 380 499 459 528 463 615 541 610 574 612 10 572 390 593 448 420 11 335 502 526 12 613 Use a 0.05 level of significance and test for a difference between the population mean for the math a. scores and the population mean for the writing scores. What is the p-value and what is your conclusion? b. What are the estimates of the population mean scores for the two tests? Which test reports the higher mean score? 1234 n6

Glencoe Algebra 1, Student Edition, 9780079039897, 0079039898, 2018
18th Edition
ISBN:9780079039897
Author:Carter
Publisher:Carter
Chapter10: Statistics
Section10.3: Measures Of Spread
Problem 22PFA

Related questions

Question
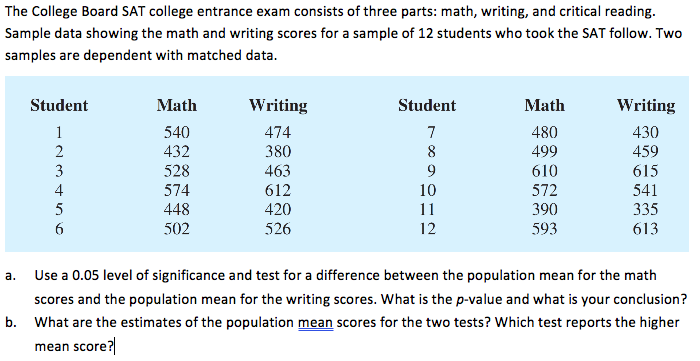
Transcribed Image Text:The College Board SAT college entrance exam consists of three parts: math, writing, and critical reading.
Sample data showing the math and writing scores for a sample of 12 students who took the SAT follow. Two
samples are dependent with matched data.
Student
Math
Writing
Student
Math
Writing
540
474
480
430
432
380
499
459
528
463
615
541
610
574
612
10
572
390
593
448
420
11
335
502
526
12
613
Use a 0.05 level of significance and test for a difference between the population mean for the math
a.
scores and the population mean for the writing scores. What is the p-value and what is your conclusion?
b. What are the estimates of the population mean scores for the two tests? Which test reports the higher
mean score?
1234 n6
Expert Solution
This question has been solved!
Explore an expertly crafted, step-by-step solution for a thorough understanding of key concepts.

This is a popular solution!

Trending now
This is a popular solution!

Step by step
Solved in 3 steps with 4 images

Knowledge Booster


Learn more about
Need a deep-dive on the concept behind this application? Look no further. Learn more about this topic, statistics and related others by exploring similar questions and additional content below.Recommended textbooks for you
Glencoe Algebra 1, Student Edition, 9780079039897…
Algebra
ISBN:
9780079039897
Author:
Carter
Publisher:
McGraw Hill
Glencoe Algebra 1, Student Edition, 9780079039897…
Algebra
ISBN:
9780079039897
Author:
Carter
Publisher:
McGraw Hill