The composite probability distribution for the random variables X and Y is given in the image: a) Find the value of the constant c. b) P(0 ≤ X ≤1/2, 0 ≤ Y≤12) =? c) Are the random variables X and Y independent? Show it.


Contingency Table
A contingency table can be defined as the visual representation of the relationship between two or more categorical variables that can be evaluated and registered. It is a categorical version of the scatterplot, which is used to investigate the linear relationship between two variables. A contingency table is indeed a type of frequency distribution table that displays two variables at the same time.
Binomial Distribution
Binomial is an algebraic expression of the sum or the difference of two terms. Before knowing about binomial distribution, we must know about the binomial theorem.
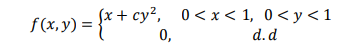
The composite probability distribution for the random variables X and Y is given in the image:
a) Find the value of the constant c.
b) P(0 ≤ X ≤1/2, 0 ≤ Y≤12) =?
c) Are the random variables X and Y independent? Show it.
d) P(0.75 < Y < 1.5|X =12) =?
e) Calculate the

Step by step
Solved in 3 steps with 3 images


