The contingency table below shows the results of a random sample of motor vehicle crash death perform a homogeneity of proportions test on the claim that the proportions of motor vehicle cras re the same for each group. Age Gender 16-24 25-34 35-44 45-54 55-64 65-74 75-84 85 and older Male 91 72 61 62 31 20 21 8 Female 36 26 26 30 20 12 15 10 Click the icon to view additional information regarding the homogeneity of proportions test.
The contingency table below shows the results of a random sample of motor vehicle crash death perform a homogeneity of proportions test on the claim that the proportions of motor vehicle cras re the same for each group. Age Gender 16-24 25-34 35-44 45-54 55-64 65-74 75-84 85 and older Male 91 72 61 62 31 20 21 8 Female 36 26 26 30 20 12 15 10 Click the icon to view additional information regarding the homogeneity of proportions test.

Holt Mcdougal Larson Pre-algebra: Student Edition 2012
1st Edition
ISBN:9780547587776
Author:HOLT MCDOUGAL
Publisher:HOLT MCDOUGAL
Chapter11: Data Analysis And Probability
Section: Chapter Questions
Problem 8CR

Related questions
Question
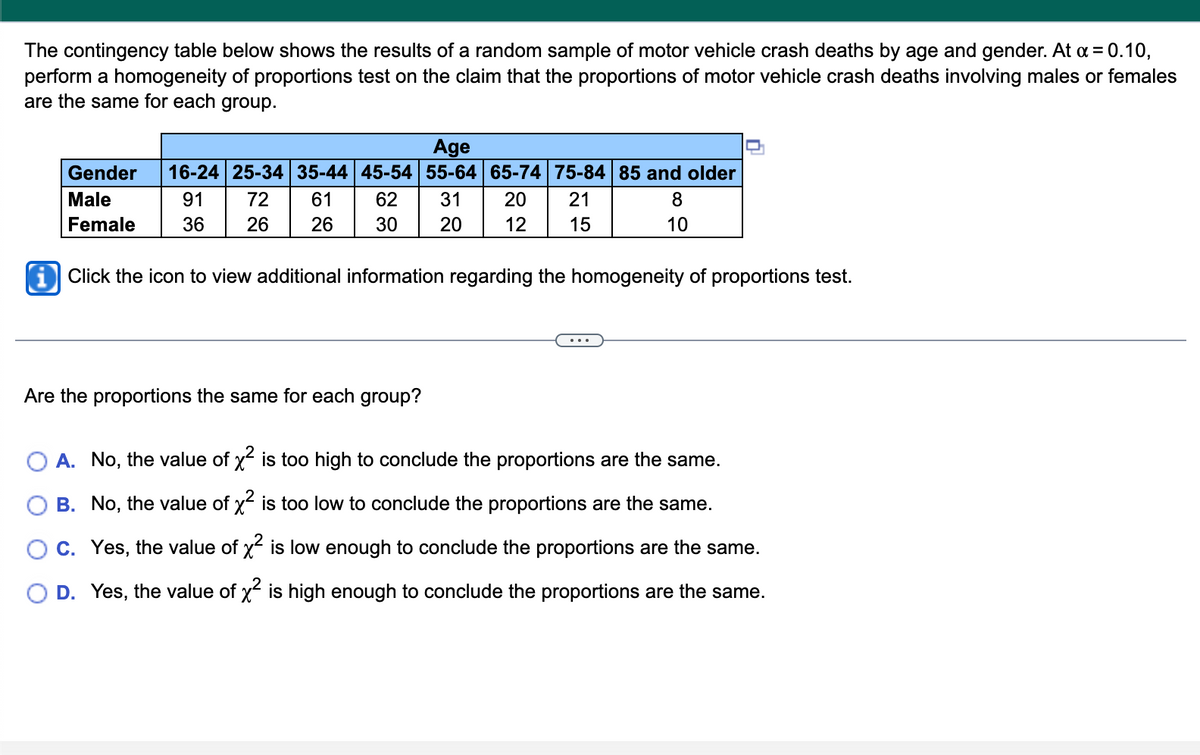
Transcribed Image Text:The contingency table below shows the results of a random sample of motor vehicle crash deaths by age and gender. At x = 0.10,
perform a homogeneity of proportions test on the claim that the proportions of motor vehicle crash deaths involving males or females
are the same for each group.
Age
Gender
16-24 25-34 | 35-44 | 45-54
55-64 65-74 75-84 | 85 and older
Male
91
72
61
62
31 20 21
8
Female
36
26
26
30
20
12
15
10
i Click the icon to view additional information regarding the homogeneity of proportions test.
Are the proportions the same for each group?
A. No, the value of x² is too high to conclude the proportions are the same.
B. No, the value of x² is too low to conclude the proportions are the same.
C. Yes, the value of x² is low enough to conclude the proportions are the same.
D. Yes, the value of x² is high enough to conclude the proportions are the same.
Expert Solution
This question has been solved!
Explore an expertly crafted, step-by-step solution for a thorough understanding of key concepts.

This is a popular solution!

Trending now
This is a popular solution!

Step by step
Solved in 3 steps

Recommended textbooks for you
Holt Mcdougal Larson Pre-algebra: Student Edition…
Algebra
ISBN:
9780547587776
Author:
HOLT MCDOUGAL
Publisher:
HOLT MCDOUGAL
Holt Mcdougal Larson Pre-algebra: Student Edition…
Algebra
ISBN:
9780547587776
Author:
HOLT MCDOUGAL
Publisher:
HOLT MCDOUGAL