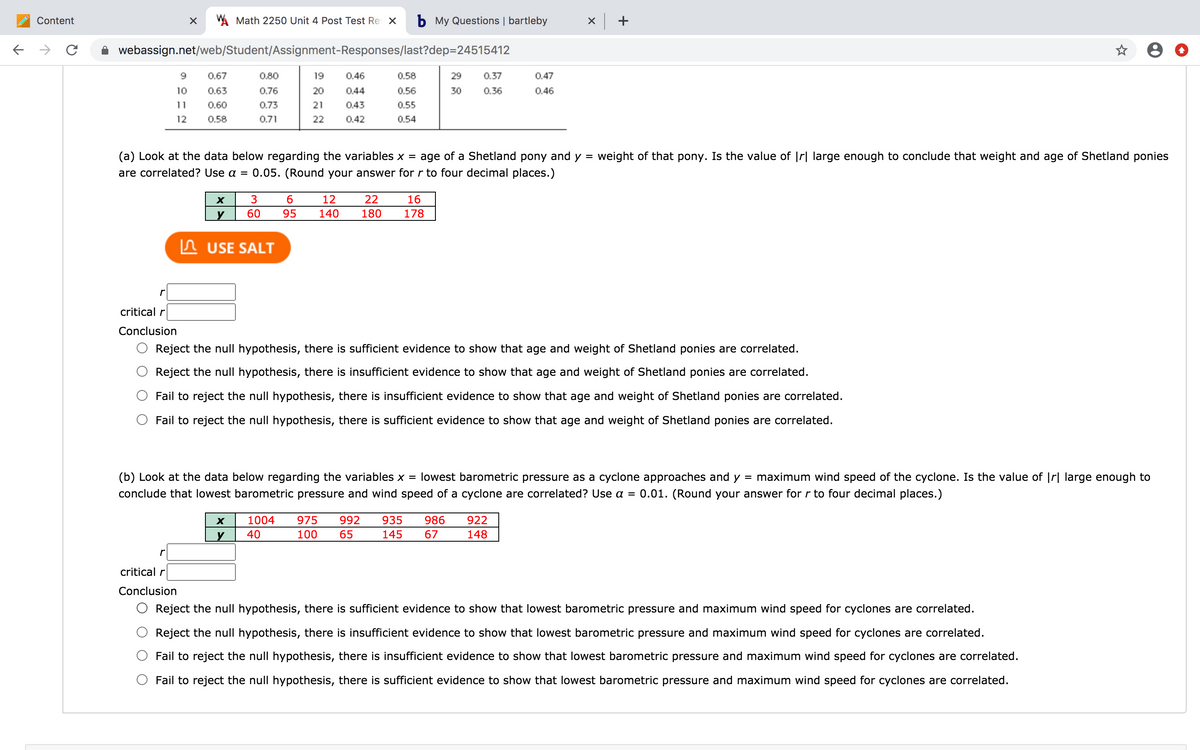
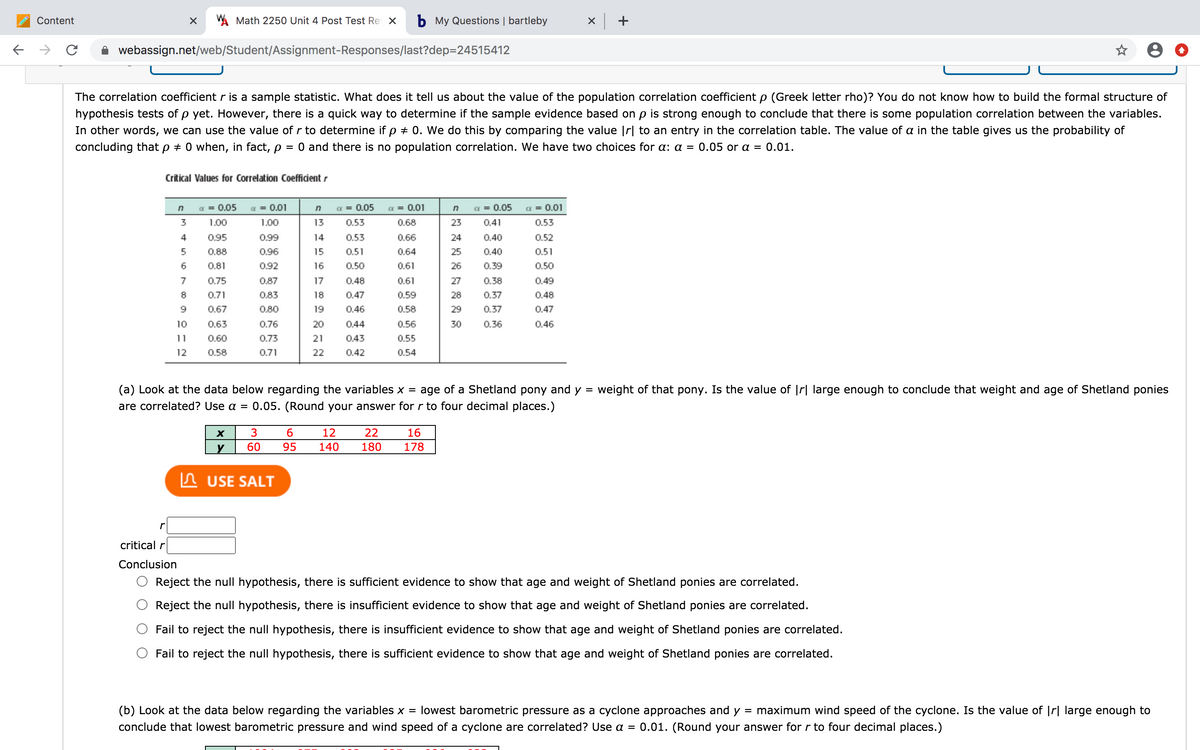
The correlation coefficient r is a sample statistic. What does it tell us about the value of the population correlation coefficient p (Greek letter rho)? You do not know how to build the formal structure of hypothesis tests of p yet. However, there is a quick way to determine if the sample evidence based on p is strong enough to conclude that there is some population correlation between the variables. In other words, we can use the value of r to determine if p + 0. We do this by comparing the value Ir| to an entry in the correlation table. The value of a in the table gives us the probability of concluding that p + 0 when, in fact, p = 0 and there is no population correlation. We have two choices for a: a = 0.05 or a = 0.01. Critical Values for Correlation Coeffident - 0.01 a- 0.05 a- 0.01 na-0.05 3 1.00 a-0.05 a- 0.01 1.00 13 0.53 0.68 23 0.41 0.53 4 0.95 0.99 14 0.53 0.66 24 0.40 0.52 5 0.88 0.96 15 0.1 0.64 25 0.40 0.51 6 0.81 0.92 16 0.50 0.61 26 0.39 0.50 0.75 087 17 0.48 0.61 27 0.38 0.49 0.71 083 18 0.47 0.59 28 0.37 0.48 9 0.67 0.80 19 0.46 0.58 29 0.37 0.47 10 0.63 0.76 20 044 0.56 30 0.36 0.46 11 0.60 0.73 21 043 0.55 12 0.58 0.71 22 0.42 0.54 (a) Look at the data below regarding the variables x = age of a Shetland pony and y = weight of that pony. Is the value of Ir| large enough to conclude that weight and age of Shetland ponies are correlated? Use a = 0.05. (Round your answer for r to four decimal places.) x| 3 6 12 22 16 178 180 y 60 95 140 n USE SALT critical r Conclusion O Reject the null hypothesis, there is sufficient evidence to show that age and weight of Shetland ponies are correlated. O Reject the null hypothesis, there is insufficient evidence to show that age and weight of Shetland ponies are correlated. Fail to reject the null hypothesis, there is insufficient evidence to show that age and weight of Shetland ponies are correlated. Fail to reject the null hypothesis, there is sufficient evidence to show that age and weight of Shetland ponies are correlated. (b) Look at the data below regarding the variables x = lowest barometric pressure as a cyclone approaches and y = maximum wind speed of the cyclone. Is the value of Irl large enough to conclude that lowest barometric pressure and wind speed of a cyclone are correlated? Use a = 0.01. (Round your answer for r to four decimal places.)


Correlation
Correlation defines a relationship between two independent variables. It tells the degree to which variables move in relation to each other. When two sets of data are related to each other, there is a correlation between them.
Linear Correlation
A correlation is used to determine the relationships between numerical and categorical variables. In other words, it is an indicator of how things are connected to one another. The correlation analysis is the study of how variables are related.
Regression Analysis
Regression analysis is a statistical method in which it estimates the relationship between a dependent variable and one or more independent variable. In simple terms dependent variable is called as outcome variable and independent variable is called as predictors. Regression analysis is one of the methods to find the trends in data. The independent variable used in Regression analysis is named Predictor variable. It offers data of an associated dependent variable regarding a particular outcome.


Trending now
This is a popular solution!

Step by step
Solved in 4 steps with 4 images


