The data below represent a random sample of the number of home fires started by candles for the past several years. (From the National Fire Protection Association.) Find the 99% confidence interval for the mean number of home fires started by candles each year. 5460 5900 6090 6310 7160 8440 9930
The data below represent a random sample of the number of home fires started by candles for the past several years. (From the National Fire Protection Association.) Find the 99% confidence interval for the mean number of home fires started by candles each year. 5460 5900 6090 6310 7160 8440 9930

Glencoe Algebra 1, Student Edition, 9780079039897, 0079039898, 2018
18th Edition
ISBN:9780079039897
Author:Carter
Publisher:Carter
Chapter10: Statistics
Section10.4: Distributions Of Data
Problem 19PFA

Related questions

Question
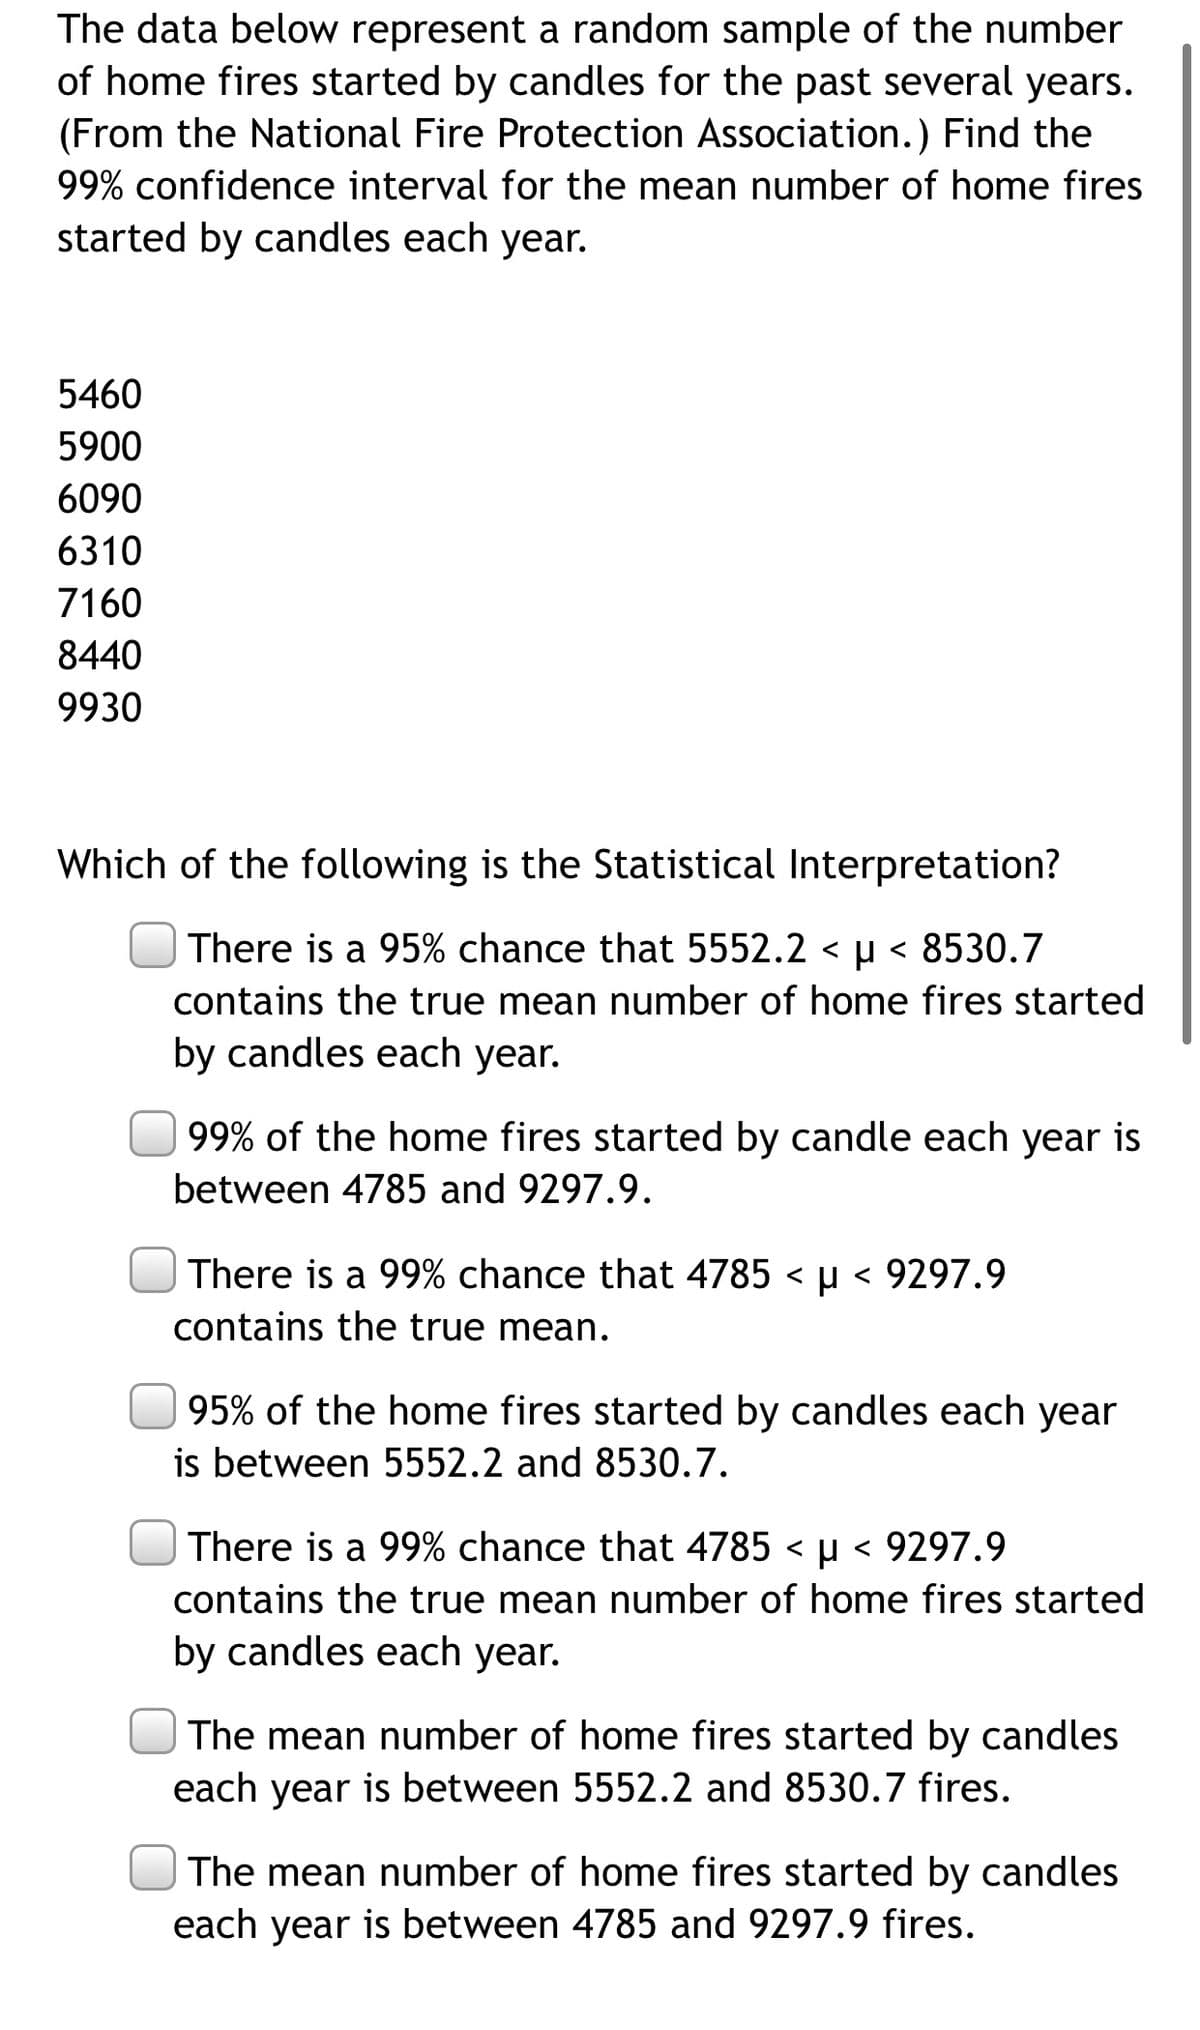
Transcribed Image Text:The data below represent a random sample of the number
of home fires started by candles for the past several years.
(From the National Fire Protection Association.) Find the
99% confidence interval for the mean number of home fires
started by candles each year.
5460
5900
6090
6310
7160
8440
9930
Which of the following is the Statistical Interpretation?
There is a 95% chance that 5552.2 < µ < 8530.7
contains the true mean number of home fires started
by candles each year.
99% of the home fires started by candle each year is
between 4785 and 9297.9.
There is a 99% chance that 4785 < µ < 9297.9
contains the true mean.
95% of the home fires started by candles each year
is between 5552.2 and 8530.7.
There is a 99% chance that 4785 < µ < 9297.9
contains the true mean number of home fires started
by candles each year.
The mean number of home fires started by candles
each year is between 5552.2 and 8530.7 fires.
The mean number of home fires started by candles
each year is between 4785 and 9297.9 fires.
Expert Solution
This question has been solved!
Explore an expertly crafted, step-by-step solution for a thorough understanding of key concepts.

This is a popular solution!

Trending now
This is a popular solution!

Step by step
Solved in 3 steps with 2 images

Knowledge Booster


Learn more about
Need a deep-dive on the concept behind this application? Look no further. Learn more about this topic, statistics and related others by exploring similar questions and additional content below.Recommended textbooks for you
Glencoe Algebra 1, Student Edition, 9780079039897…
Algebra
ISBN:
9780079039897
Author:
Carter
Publisher:
McGraw Hill
Glencoe Algebra 1, Student Edition, 9780079039897…
Algebra
ISBN:
9780079039897
Author:
Carter
Publisher:
McGraw Hill